Supplementary listening page

RAV-Net Speech Separation Samples

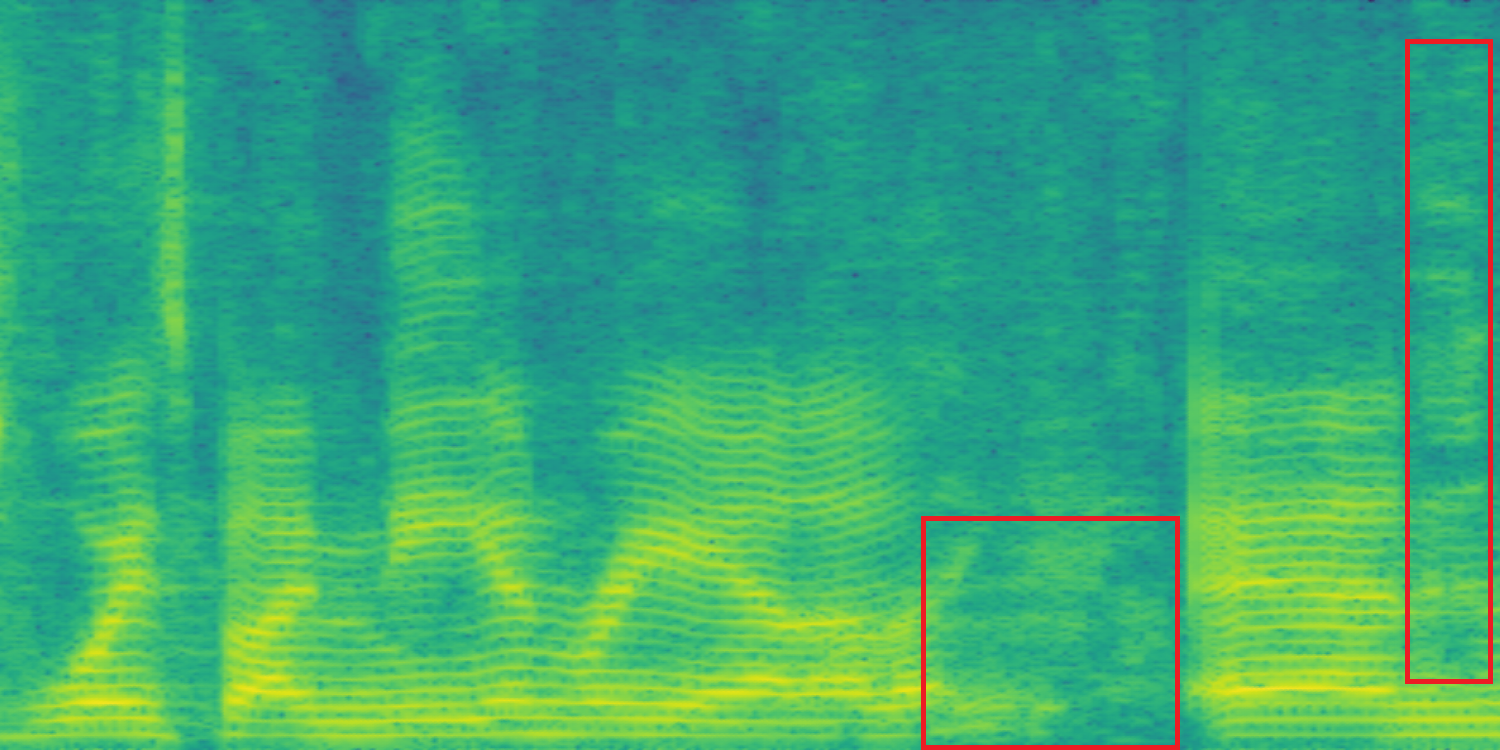
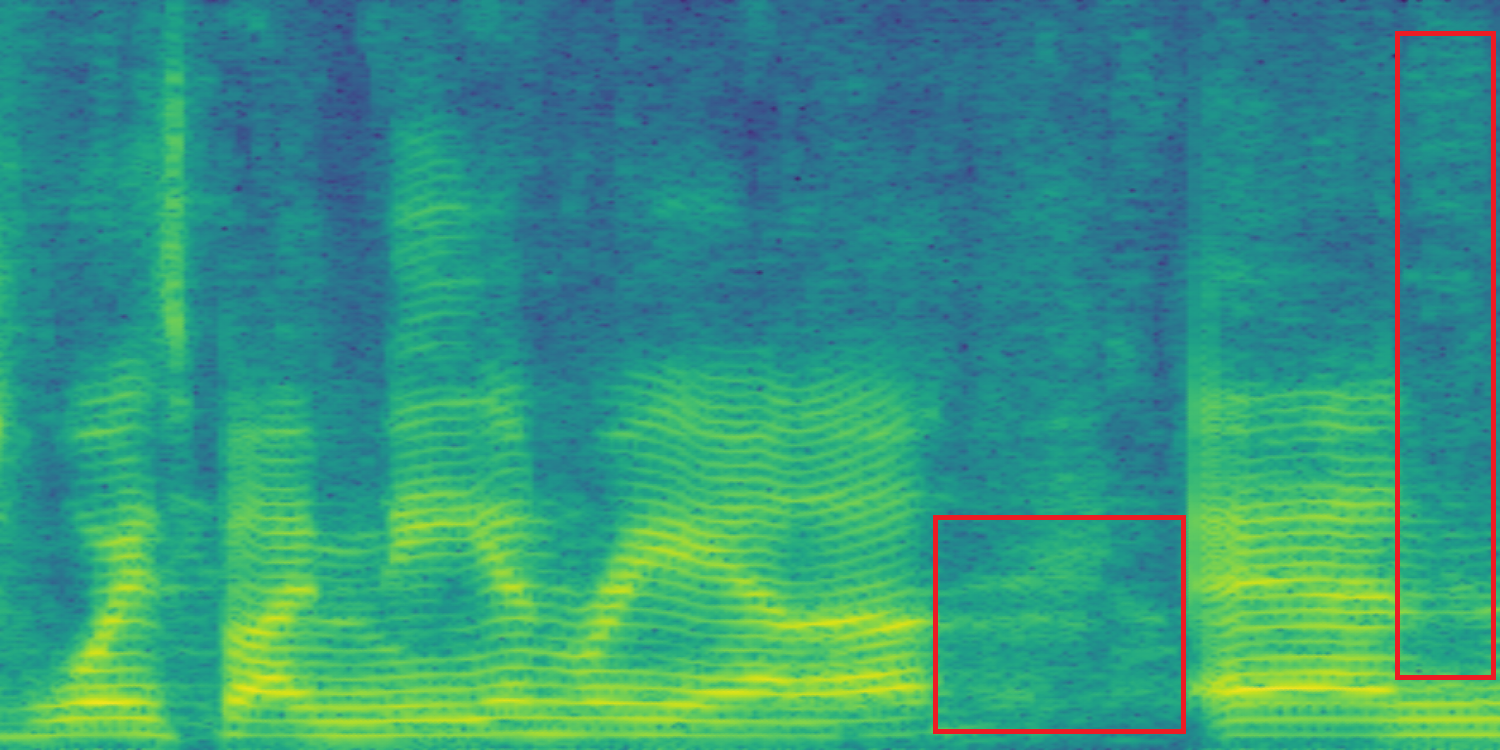
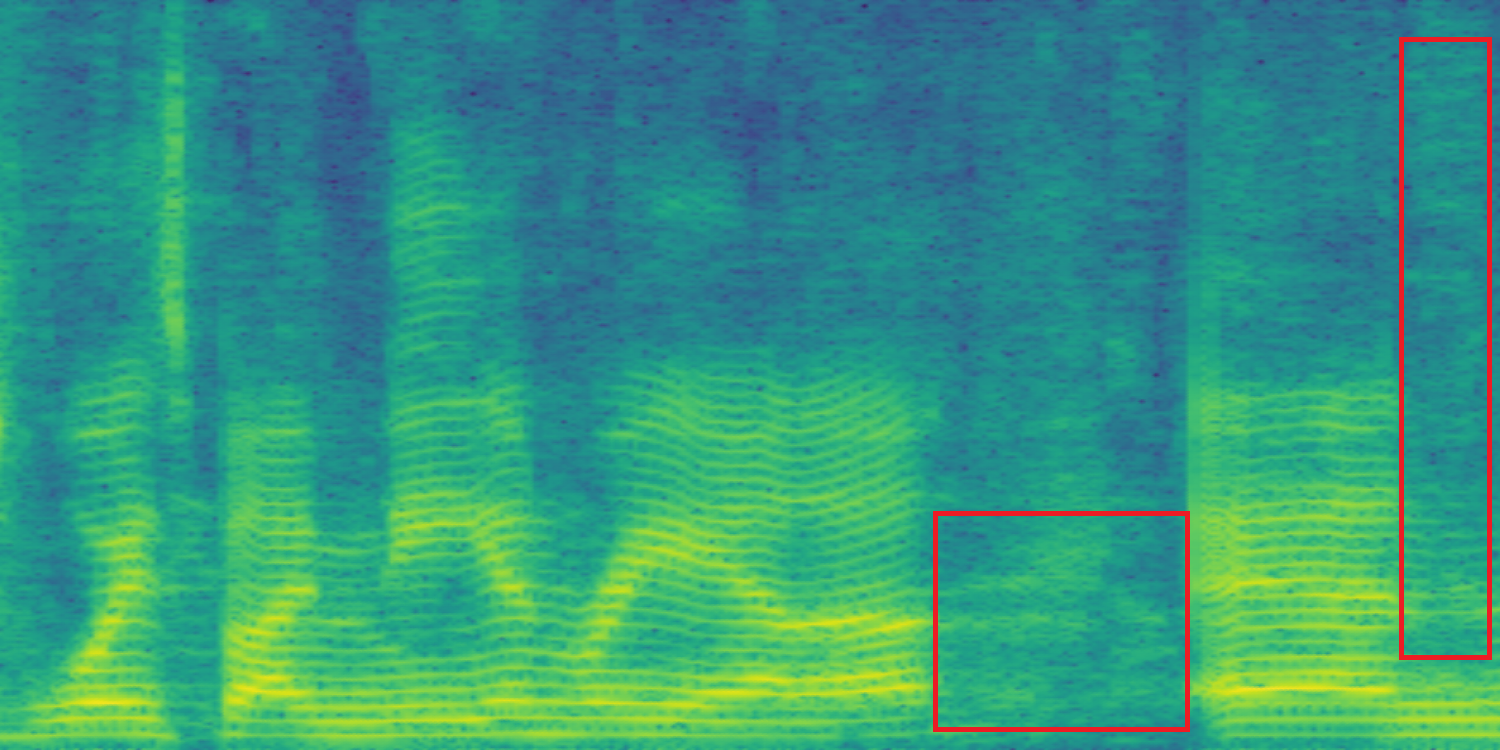
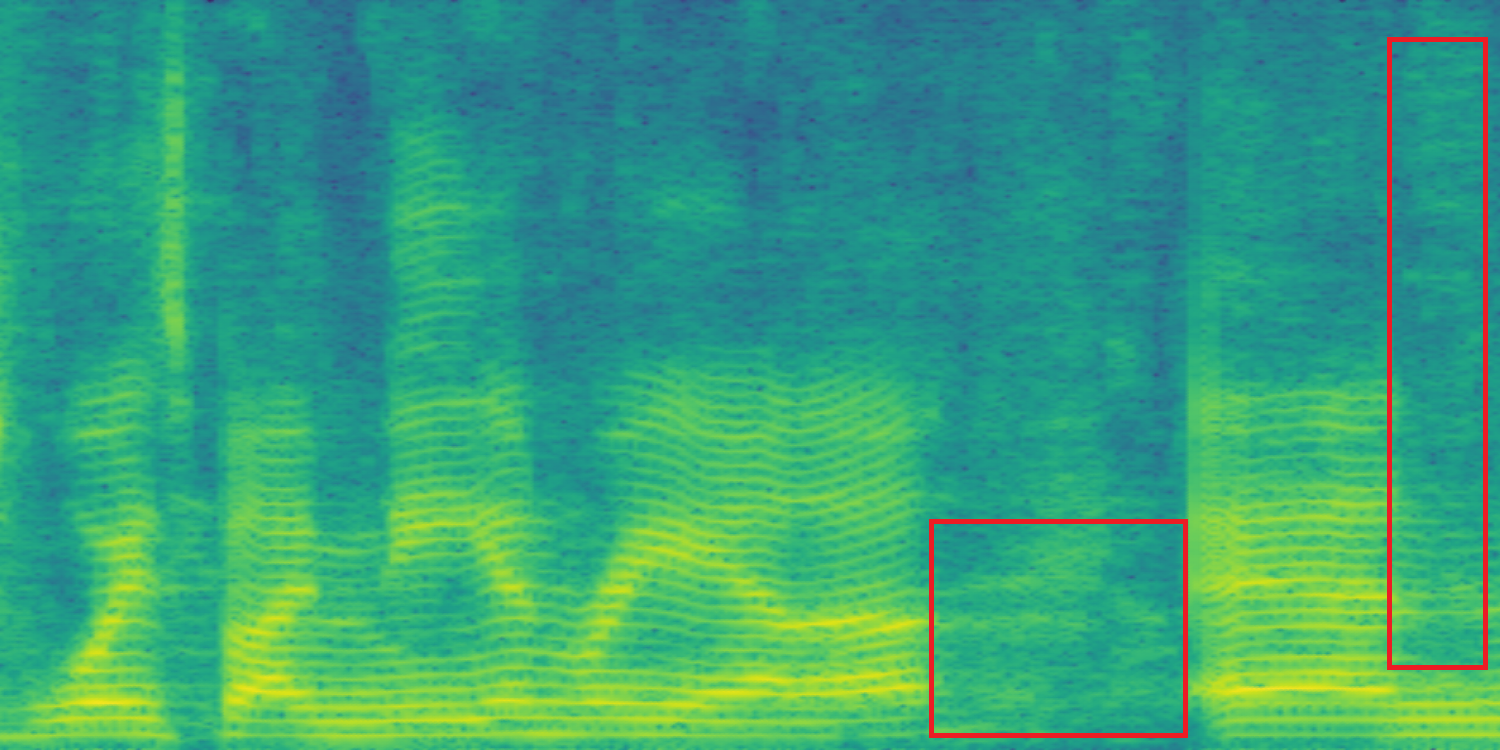
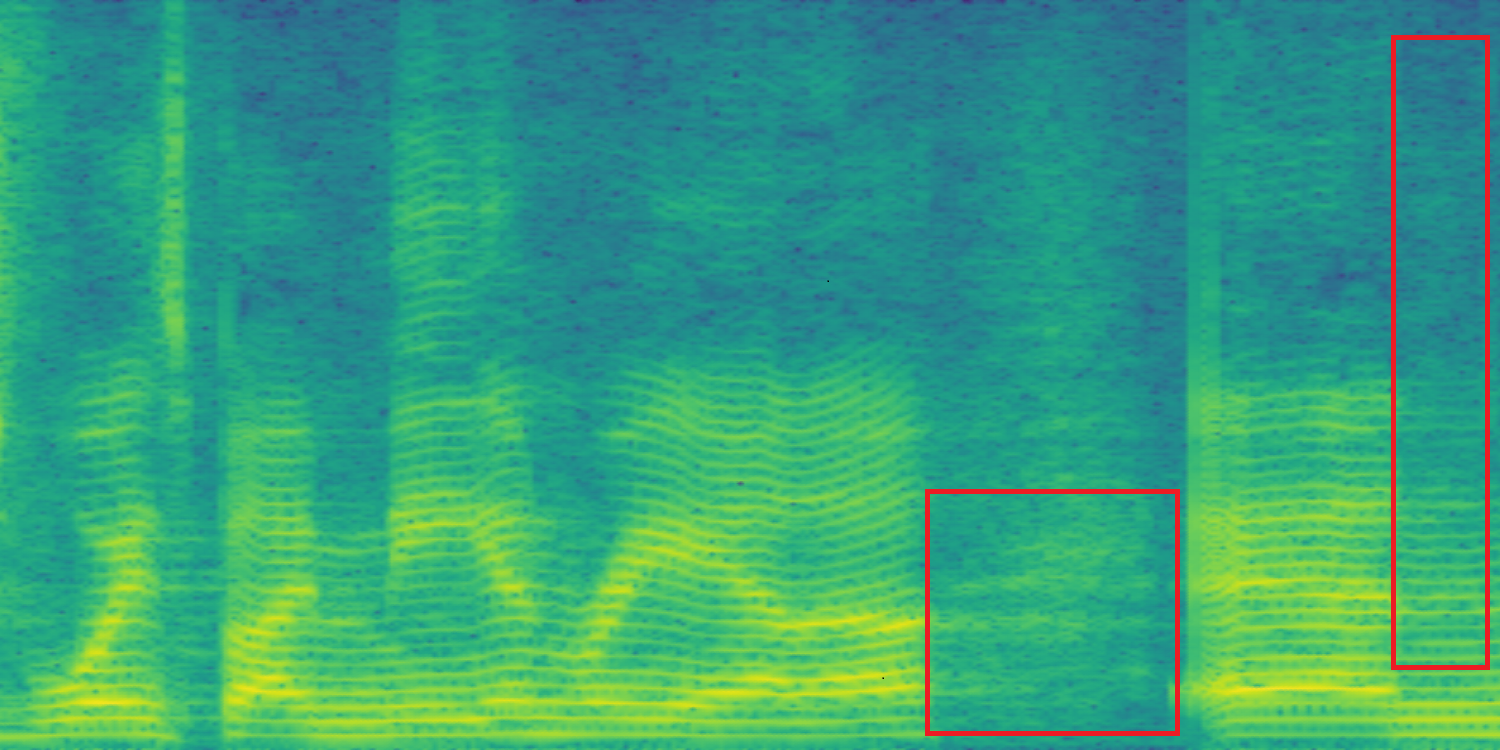
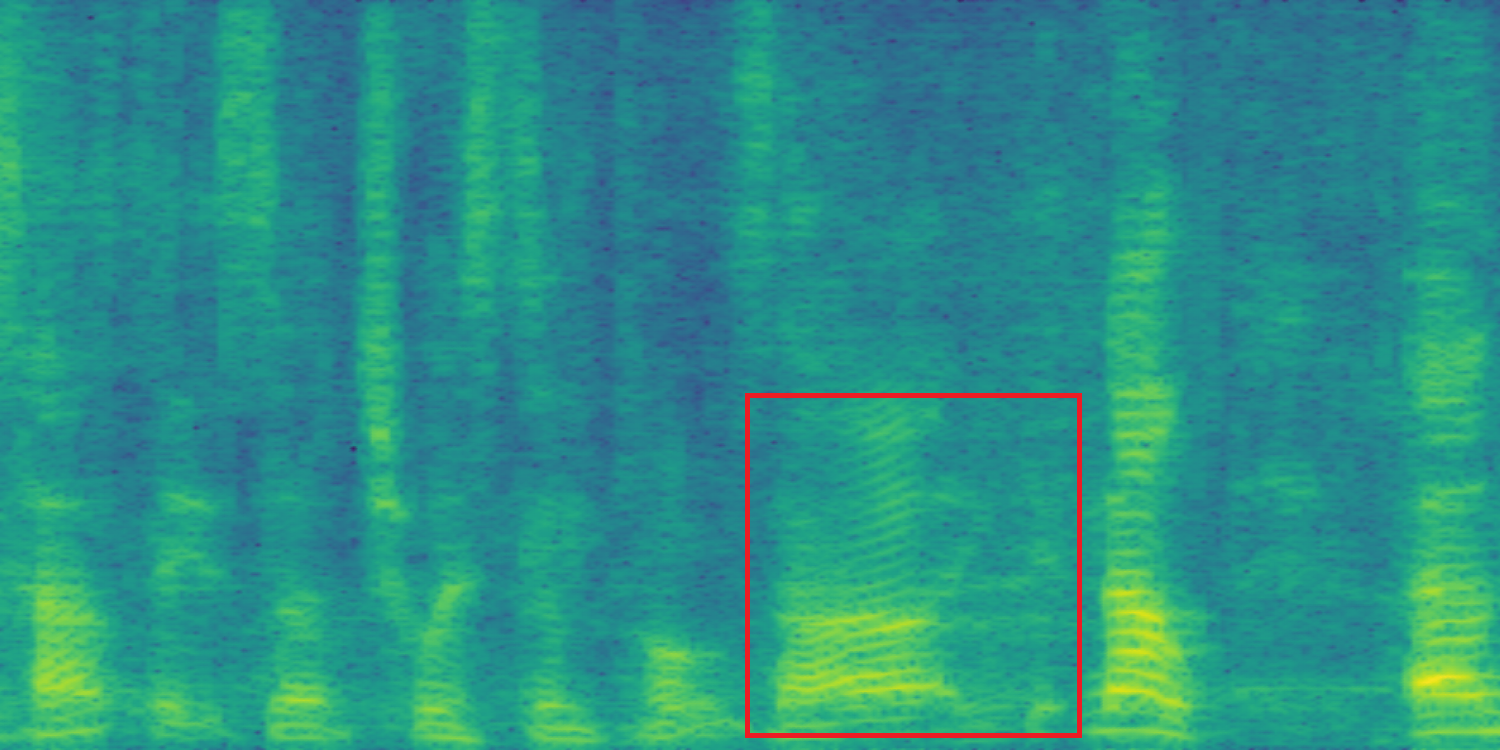
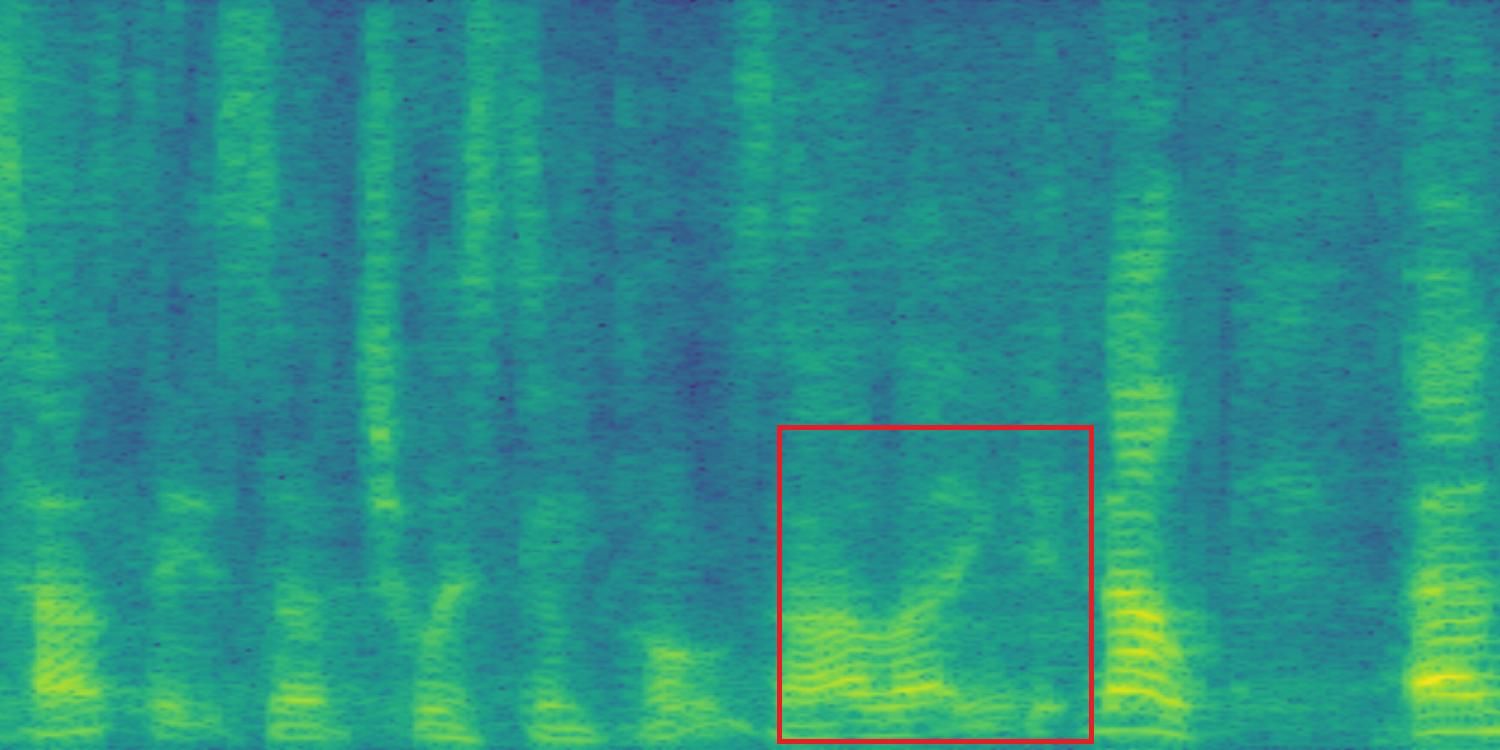
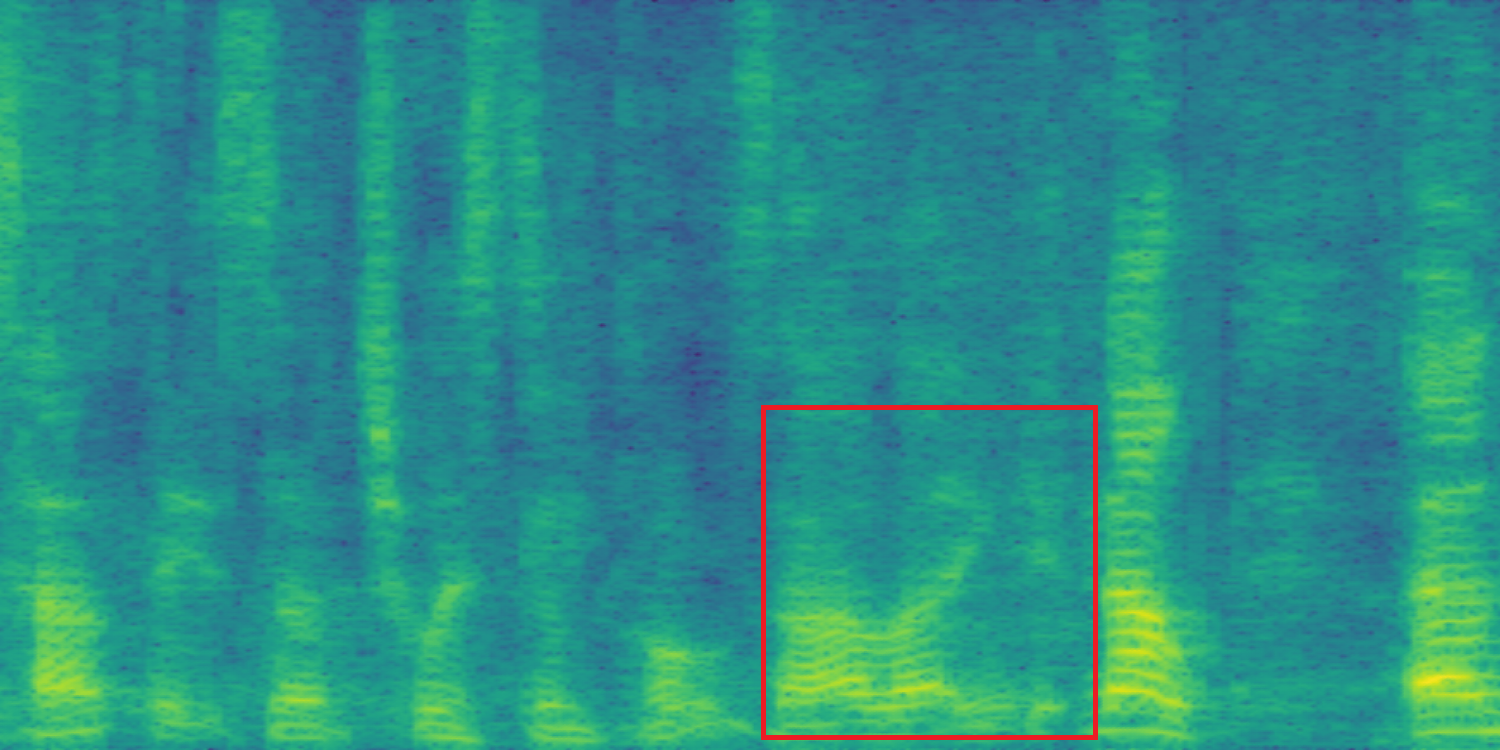
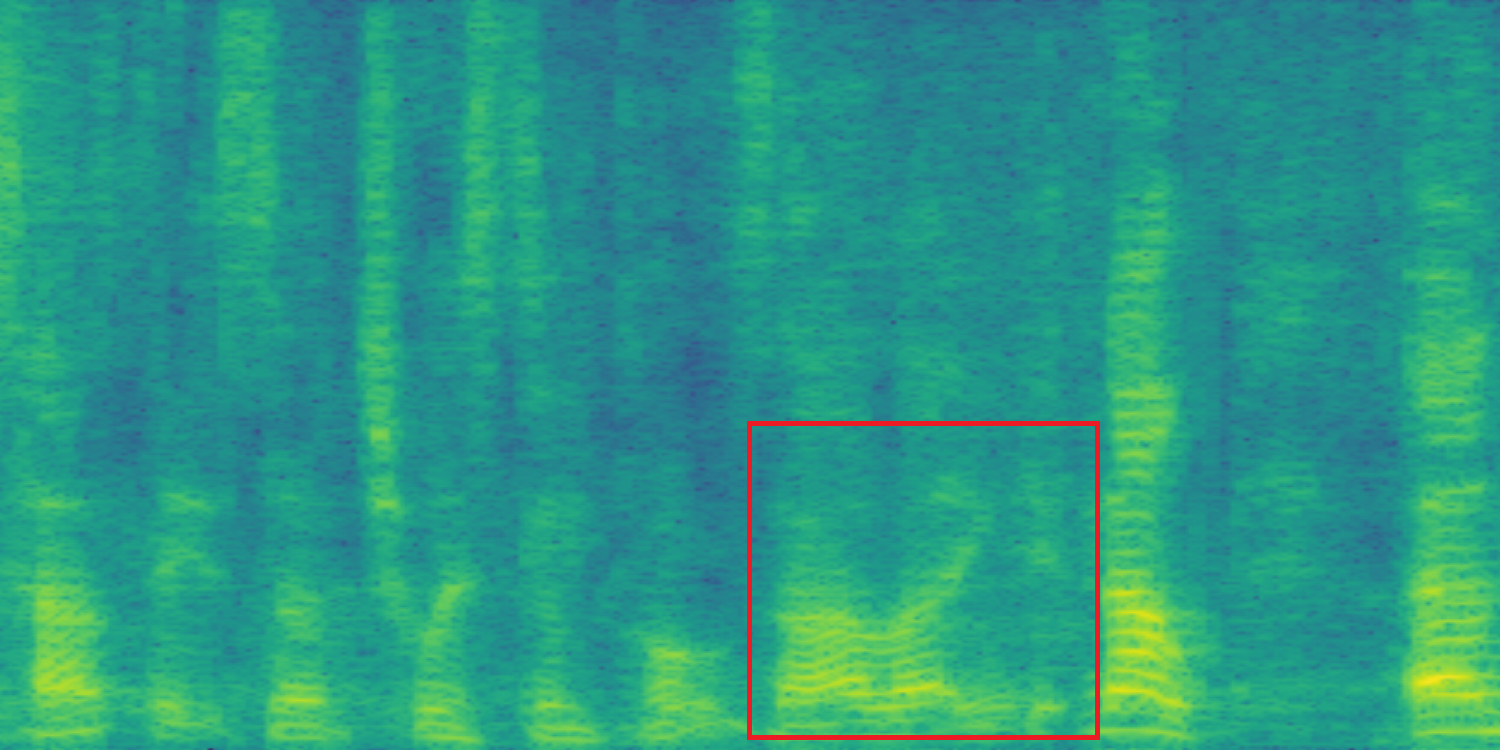
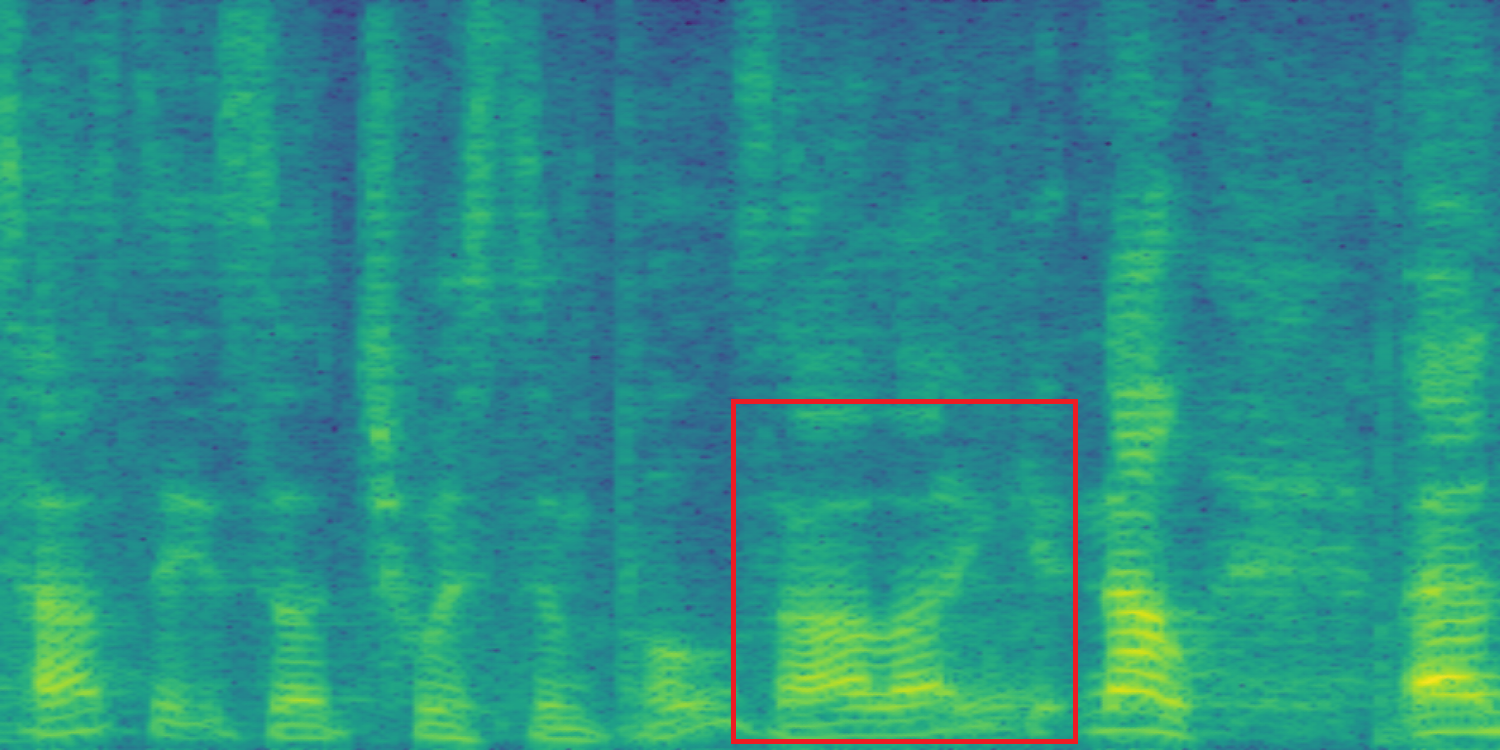
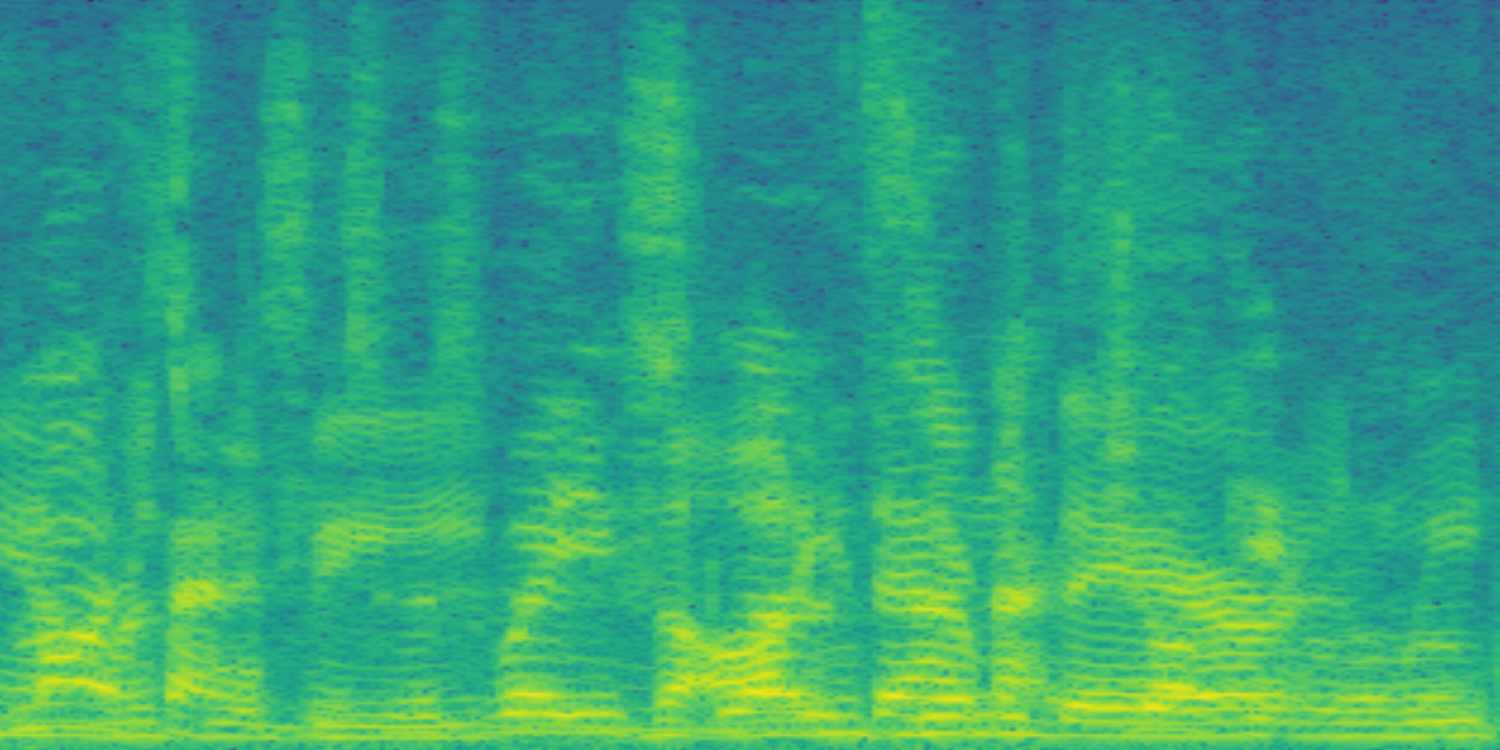
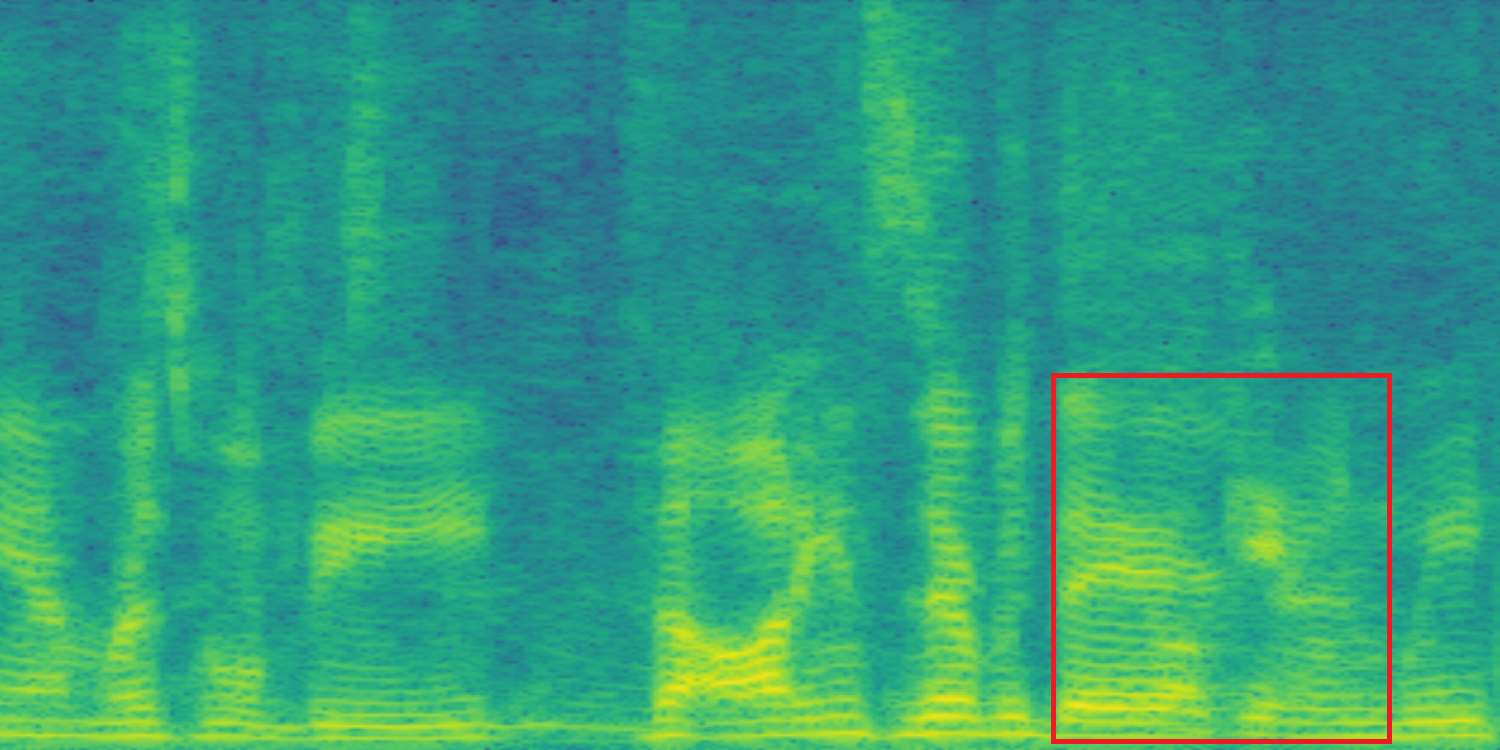
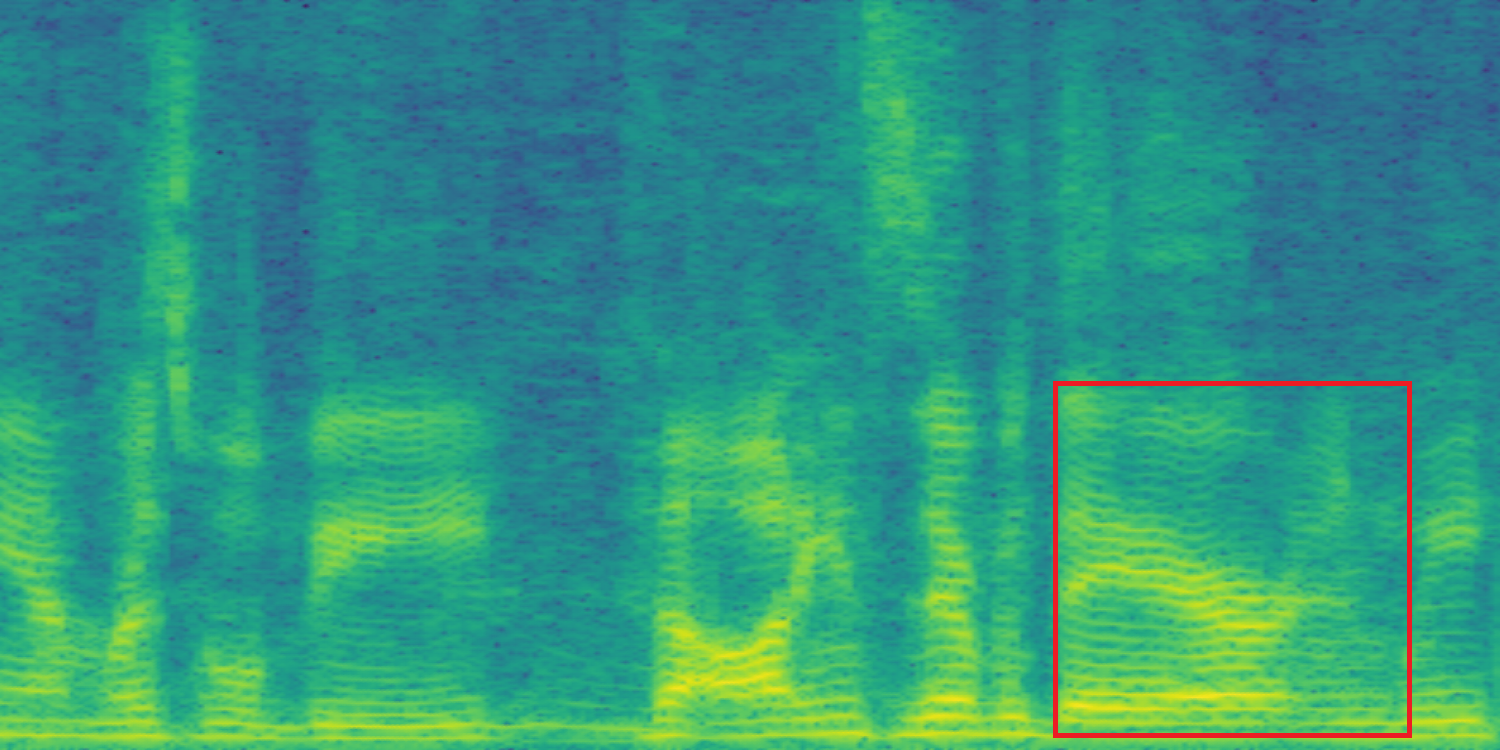
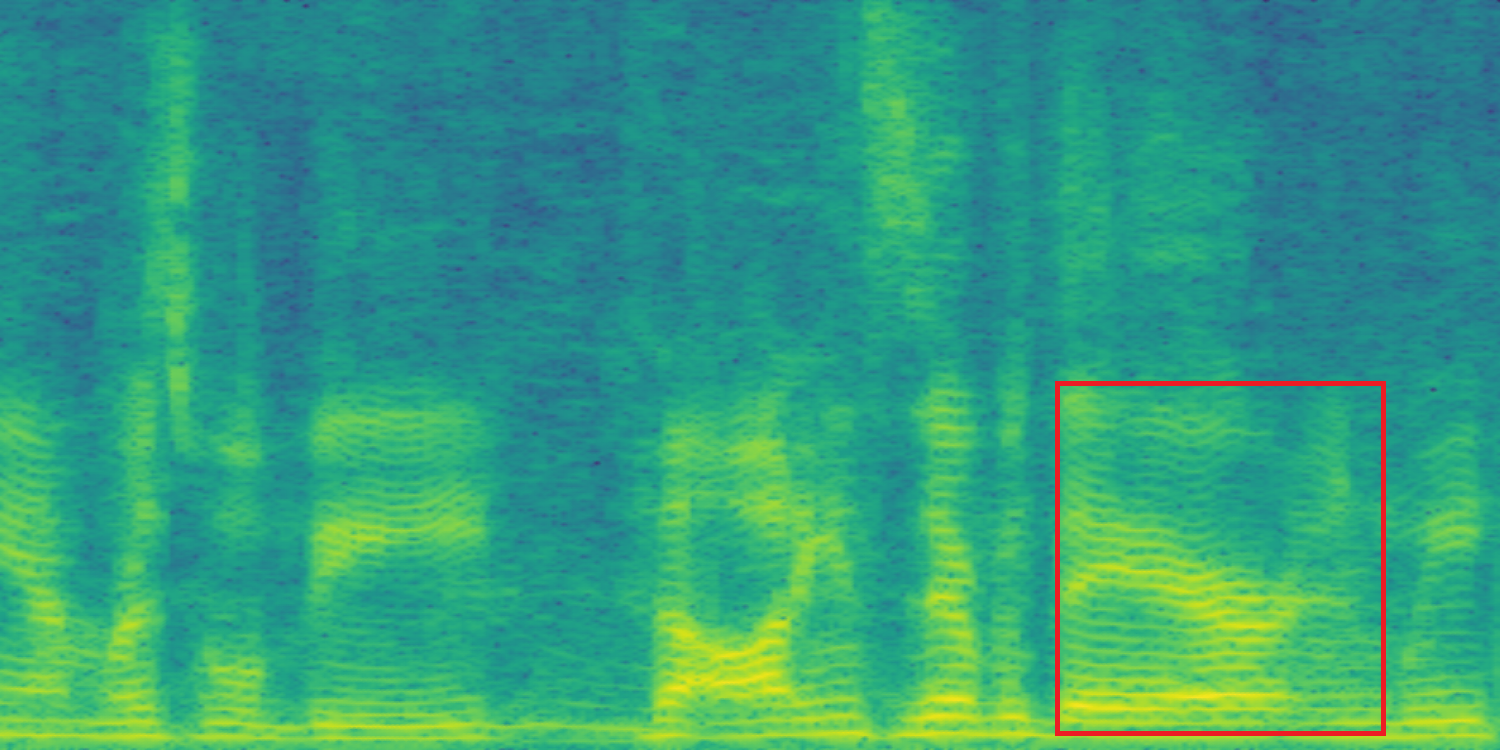
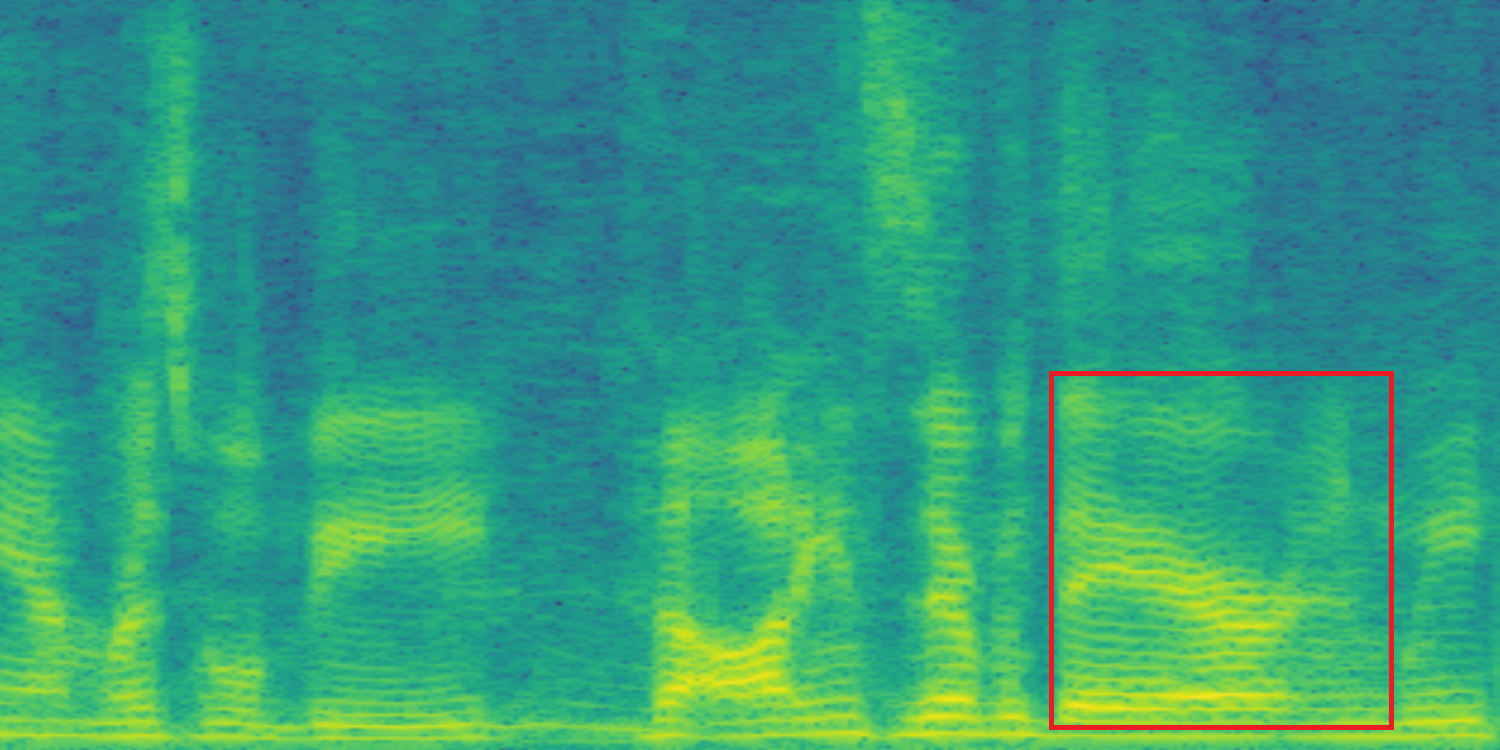
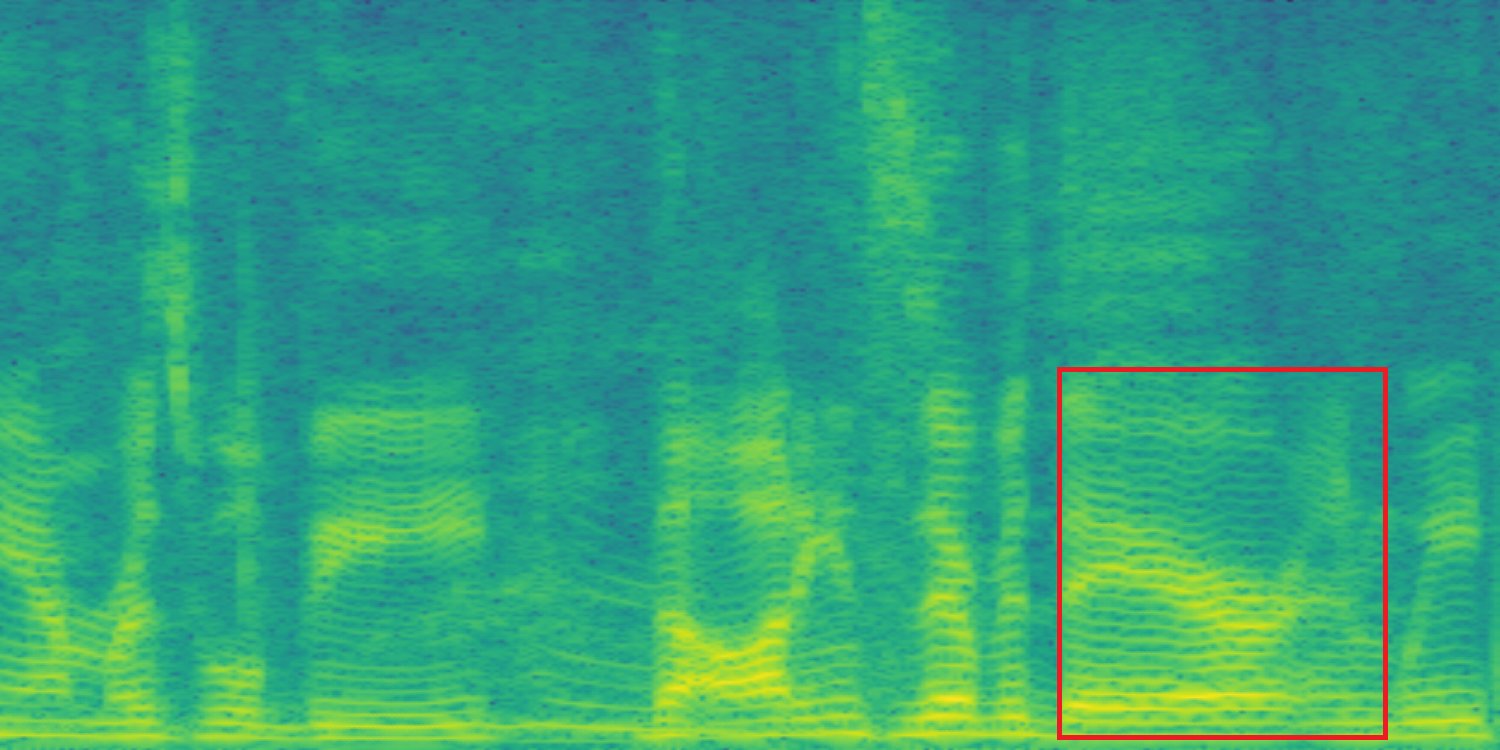
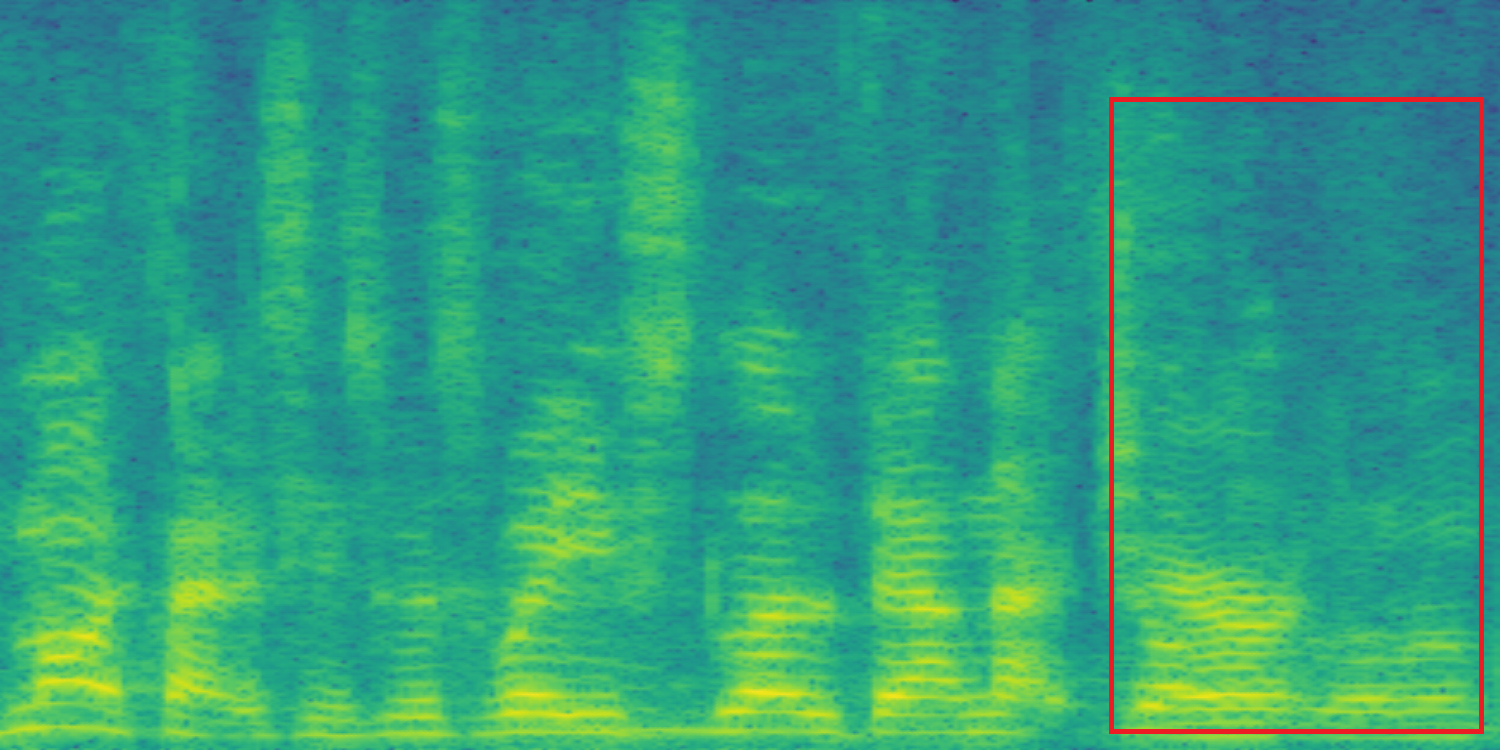
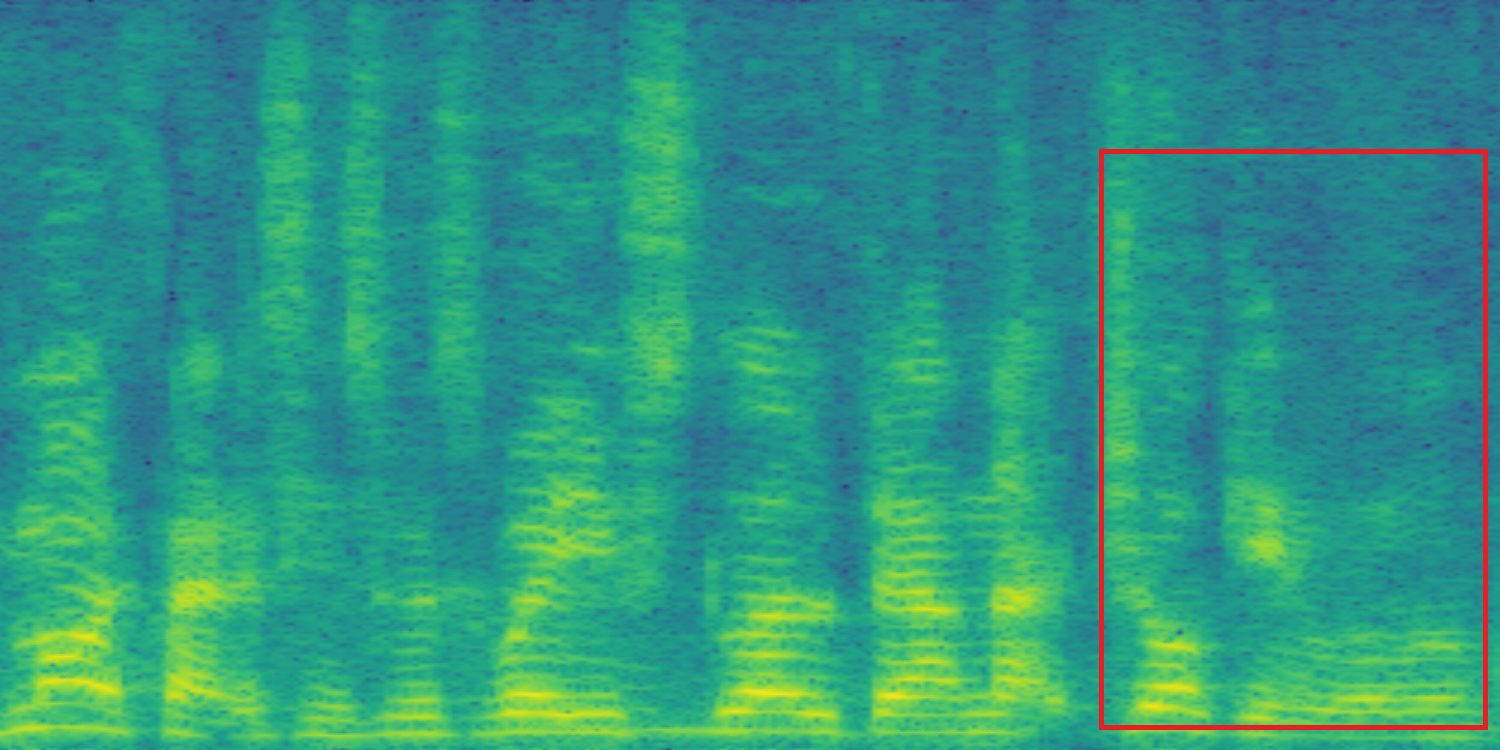
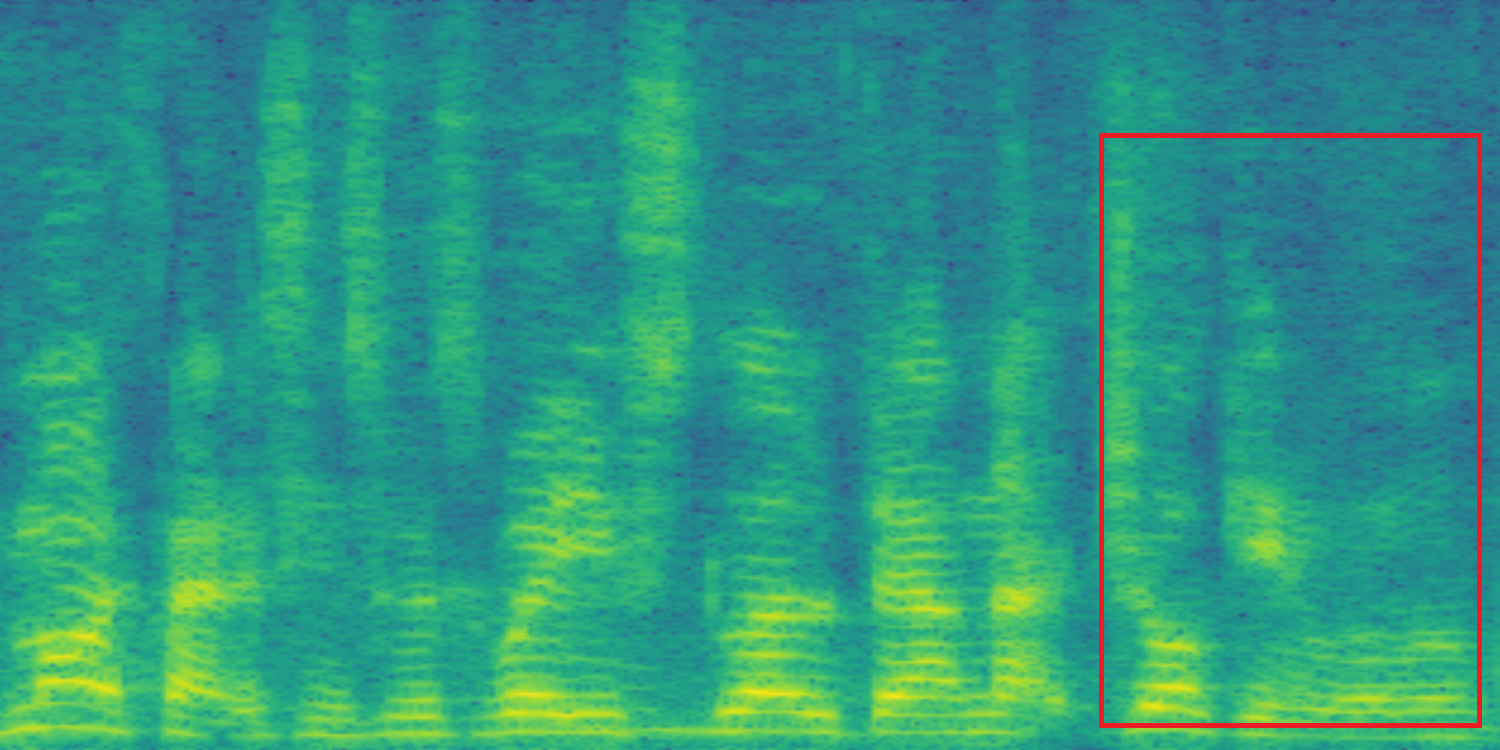
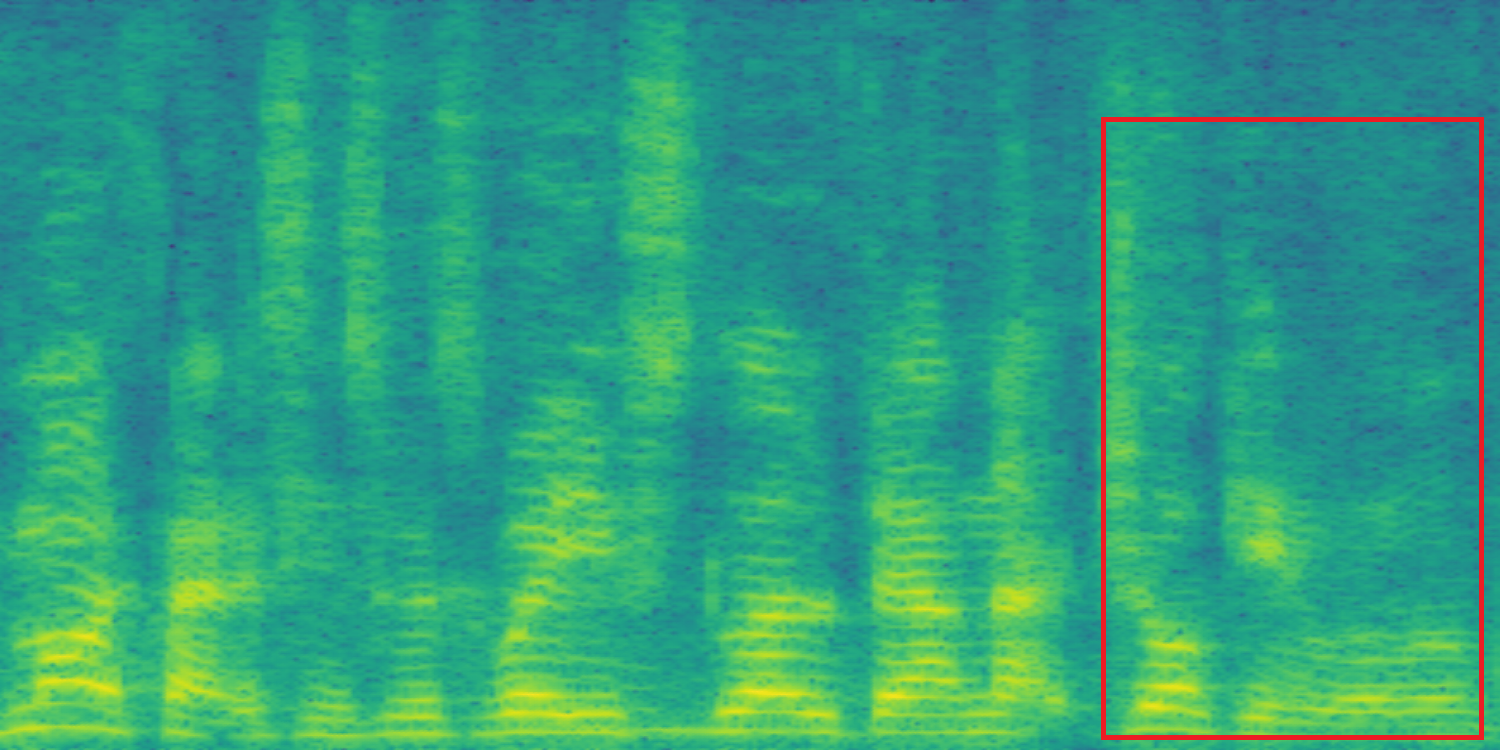
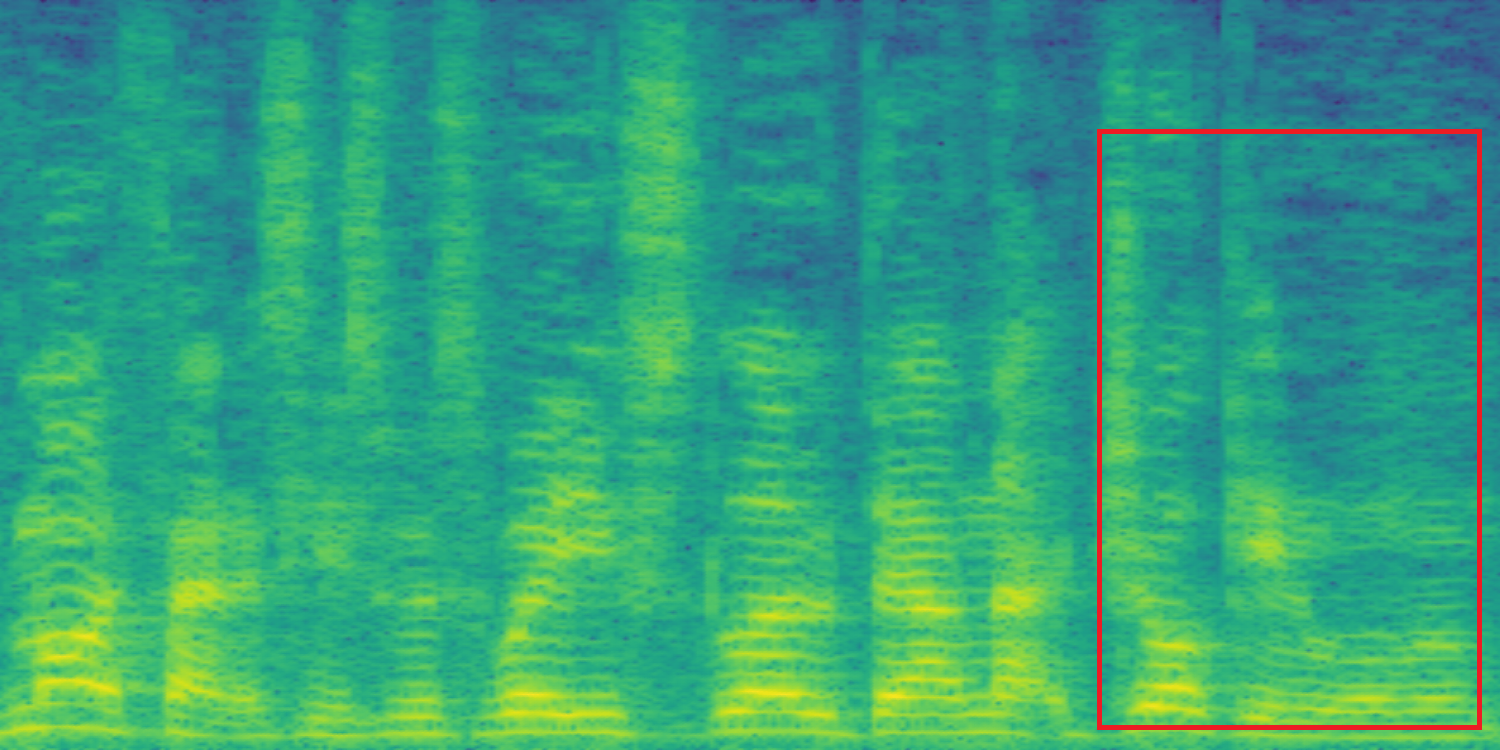
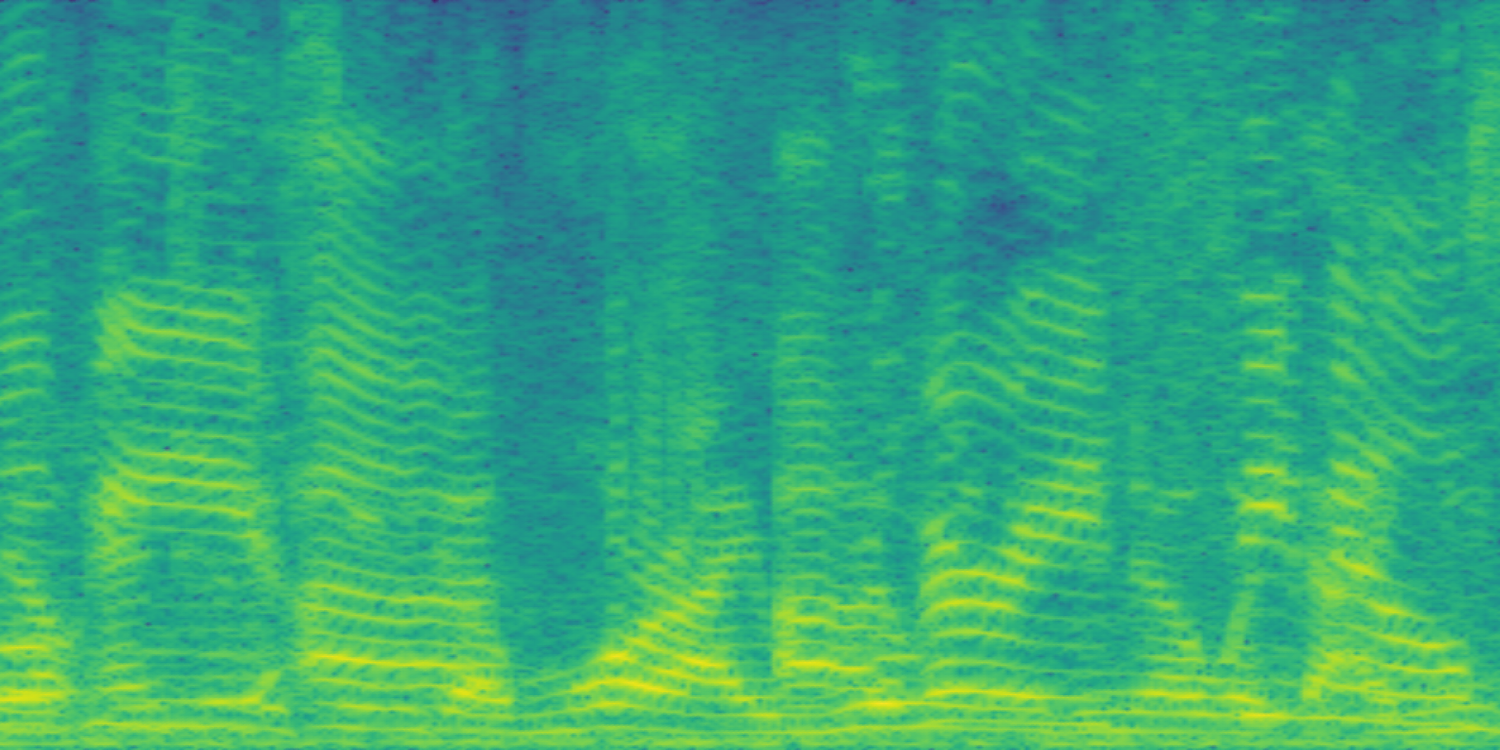
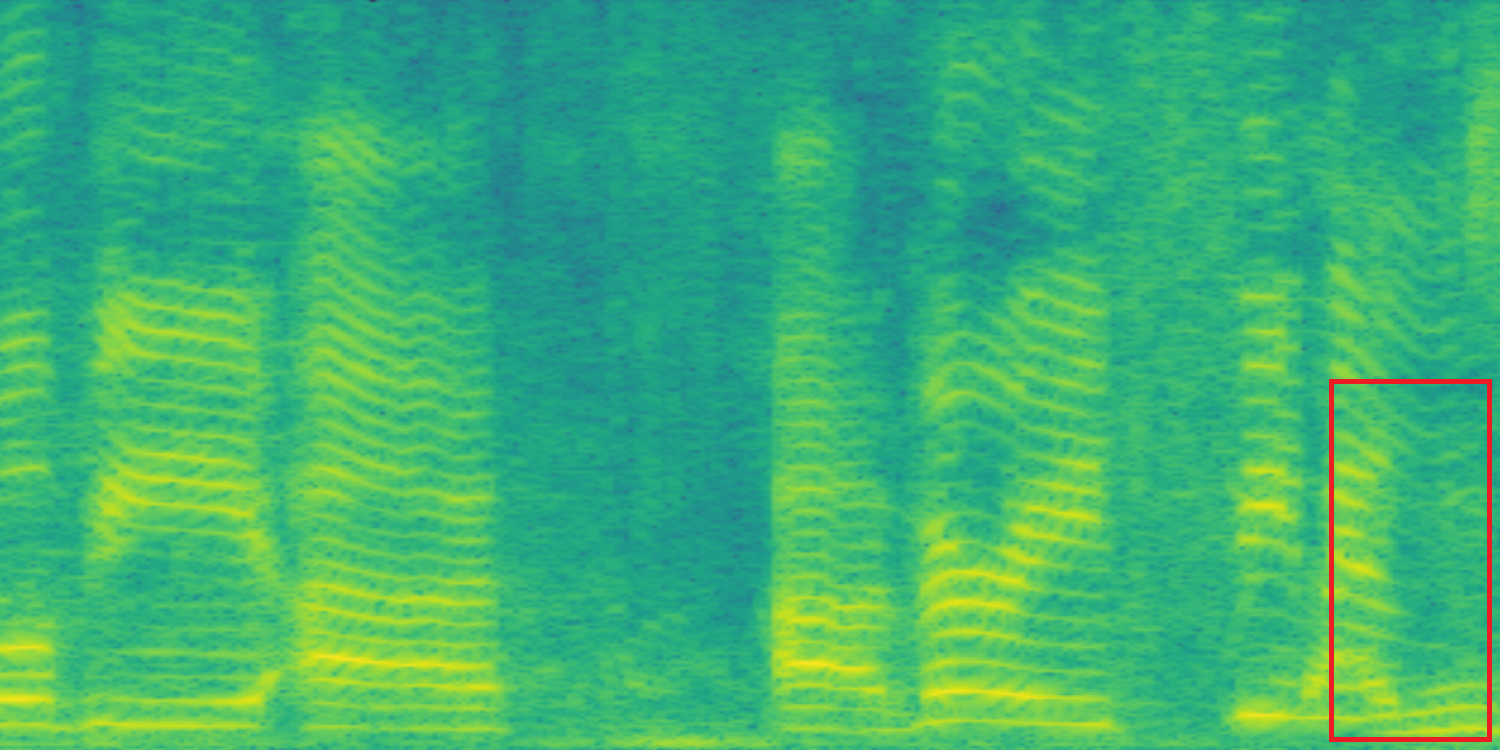
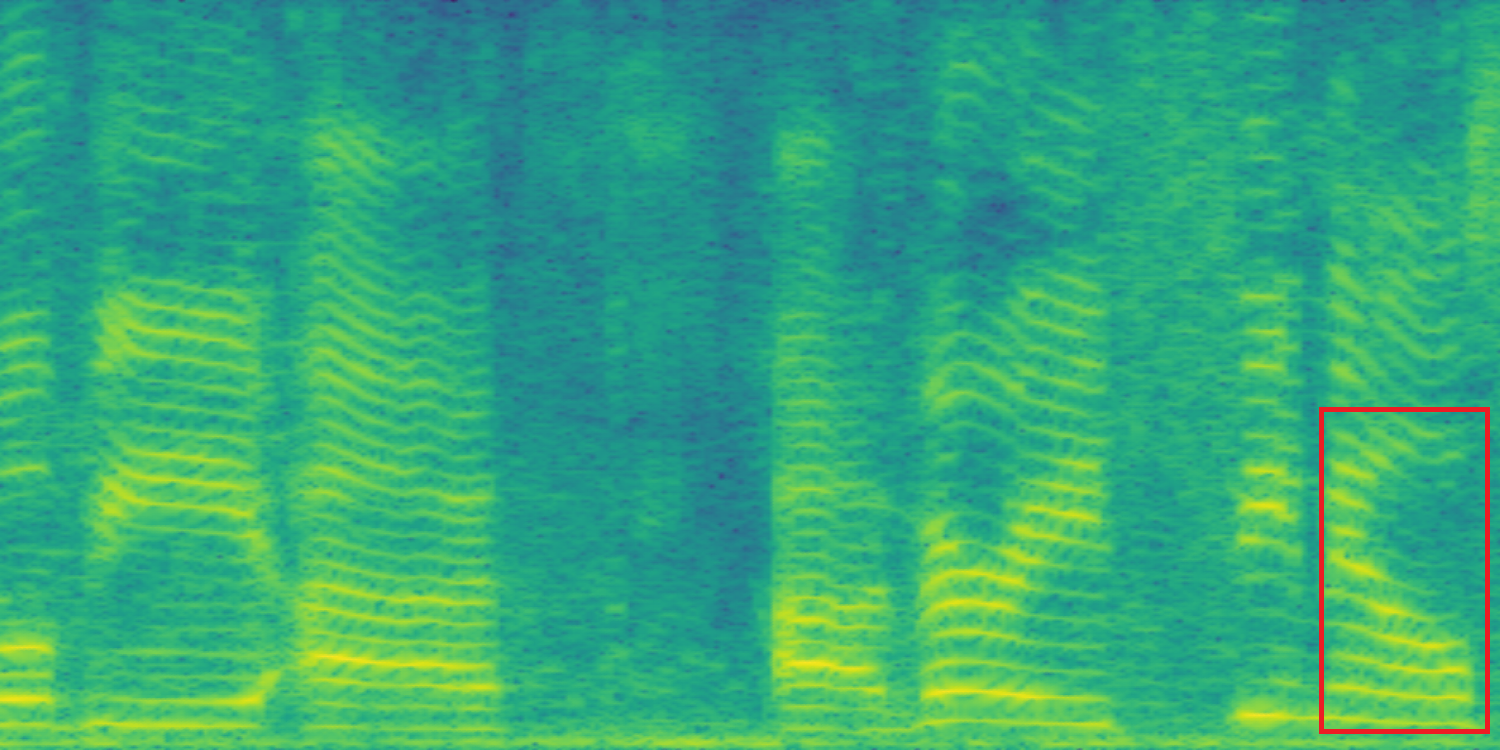
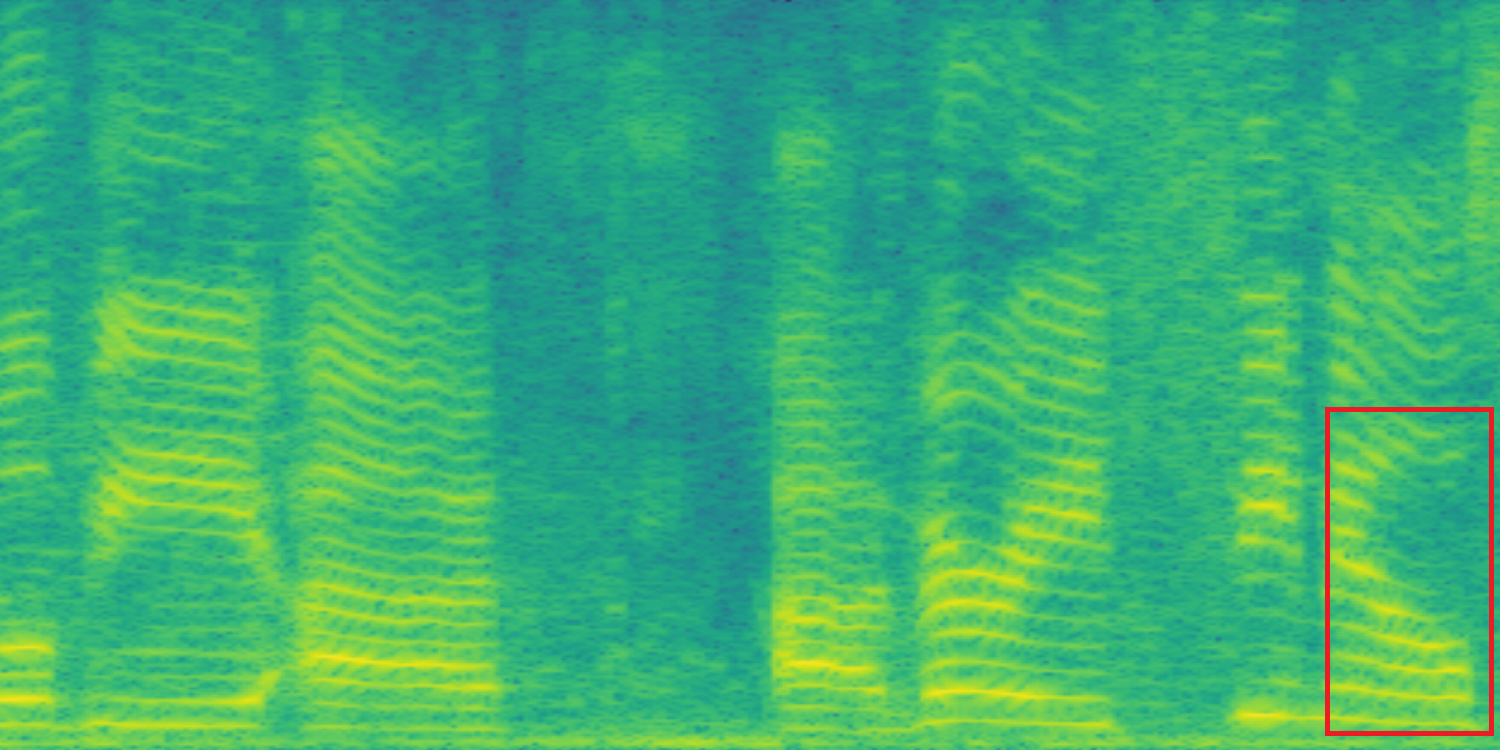
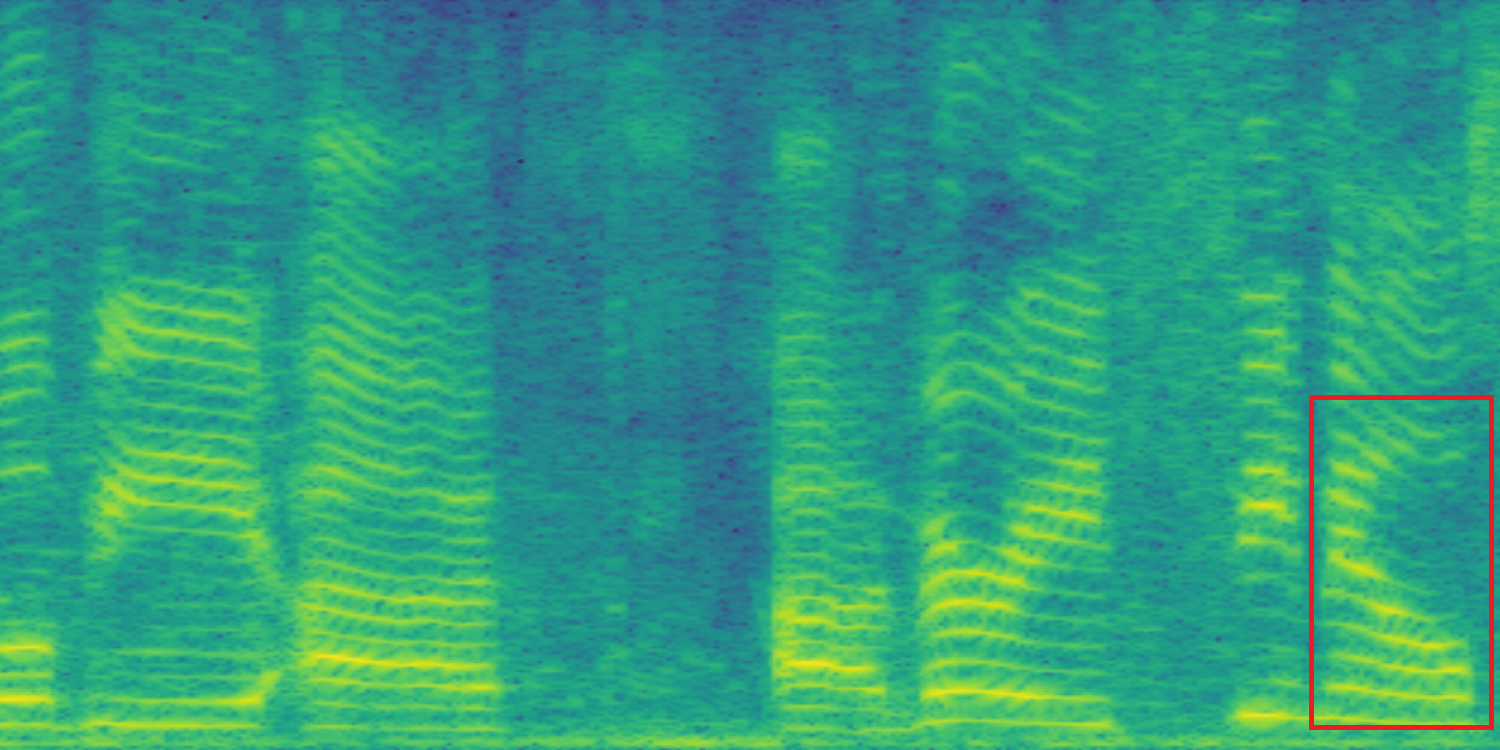
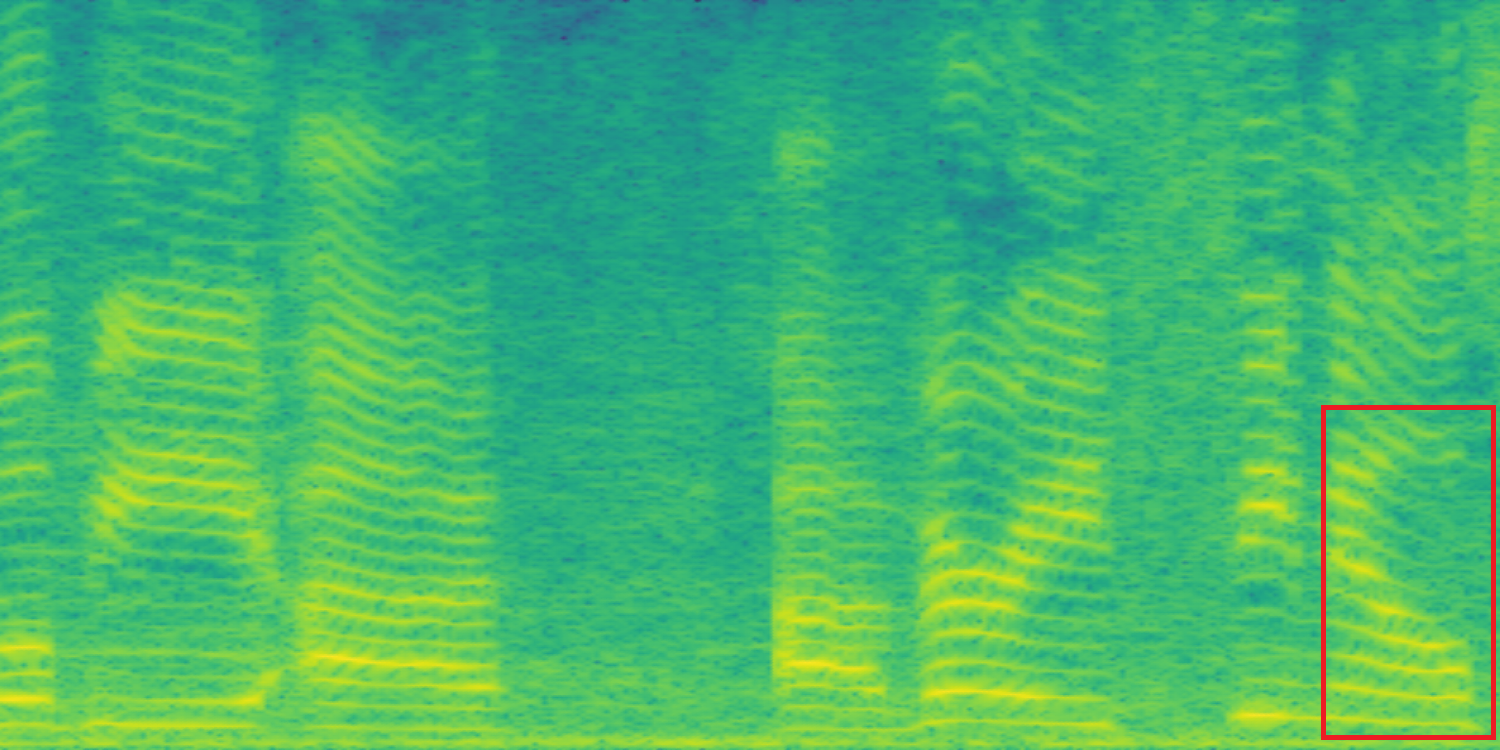
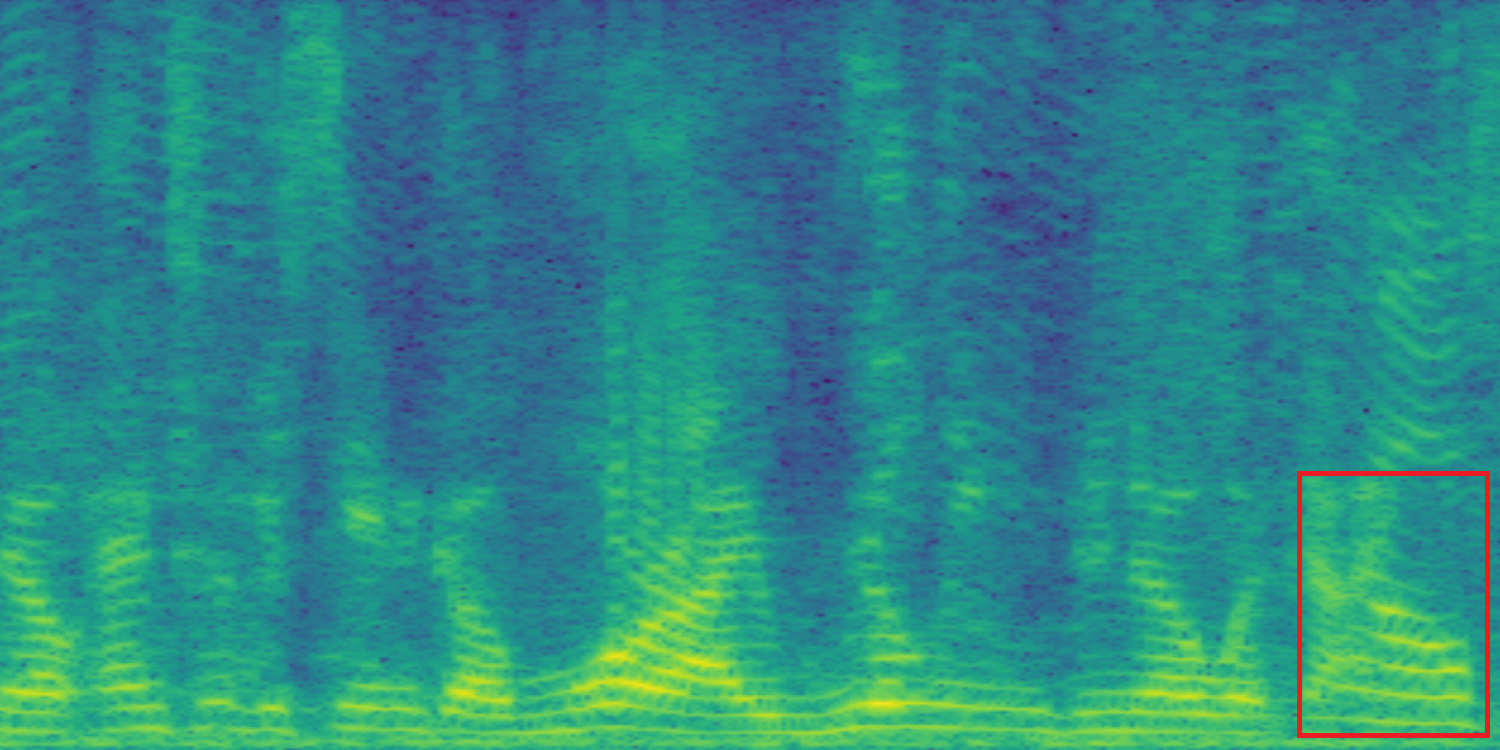
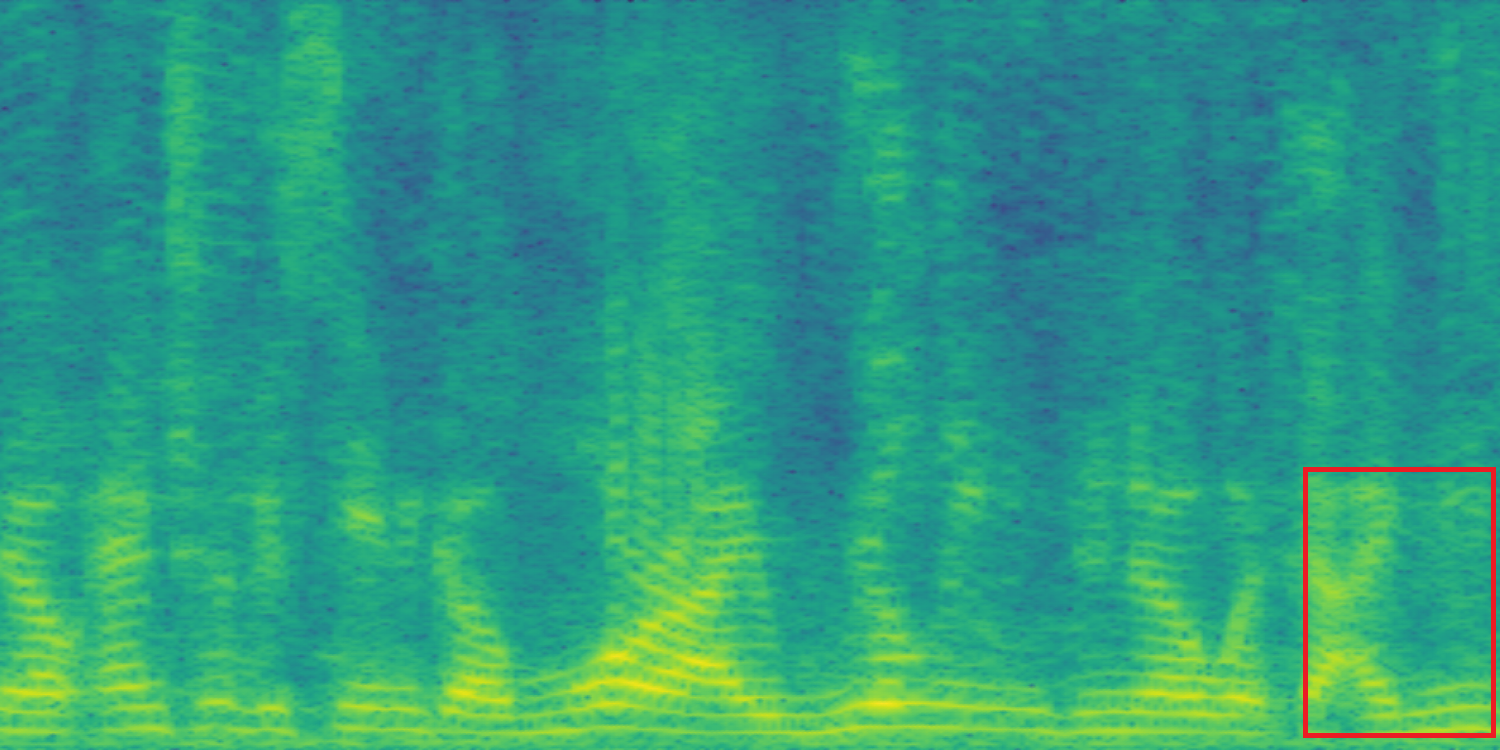
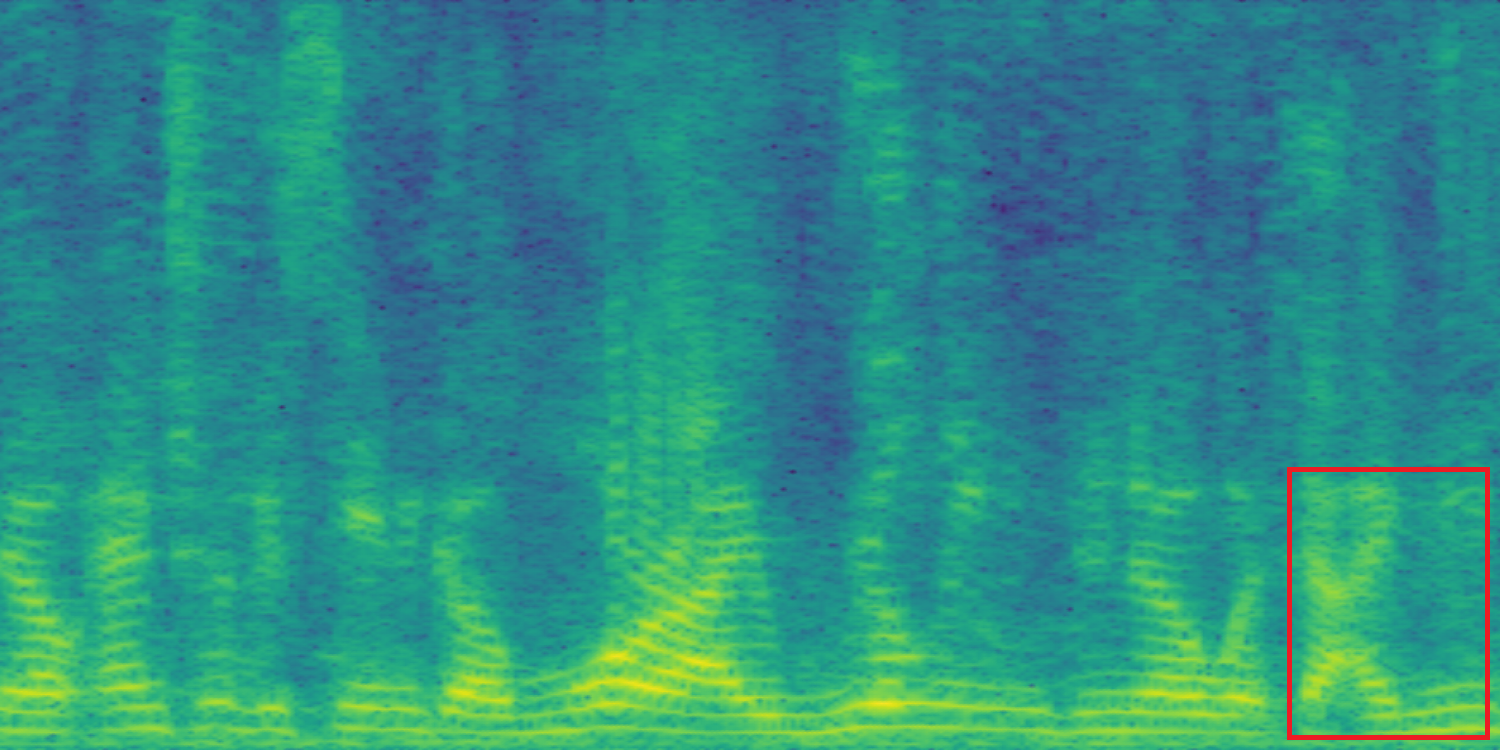
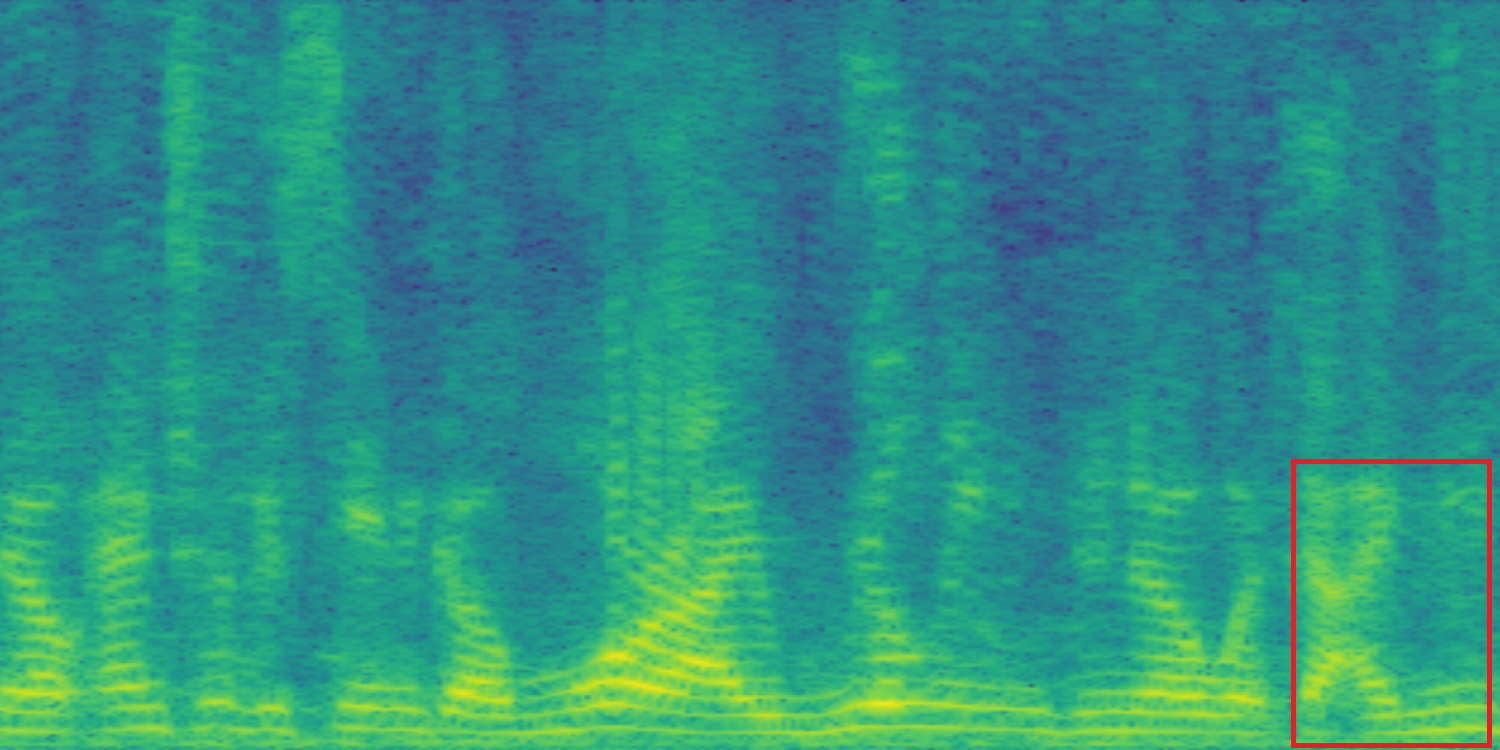
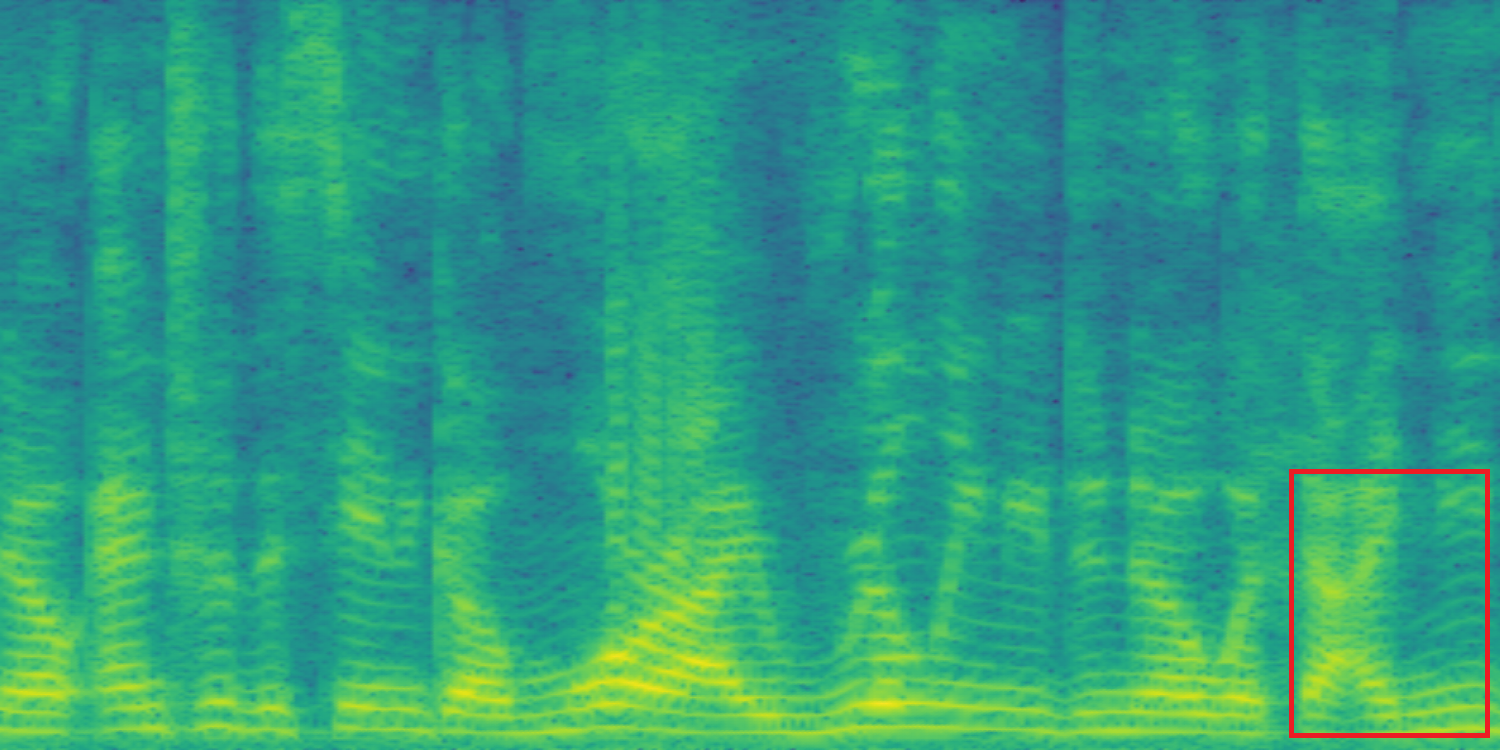
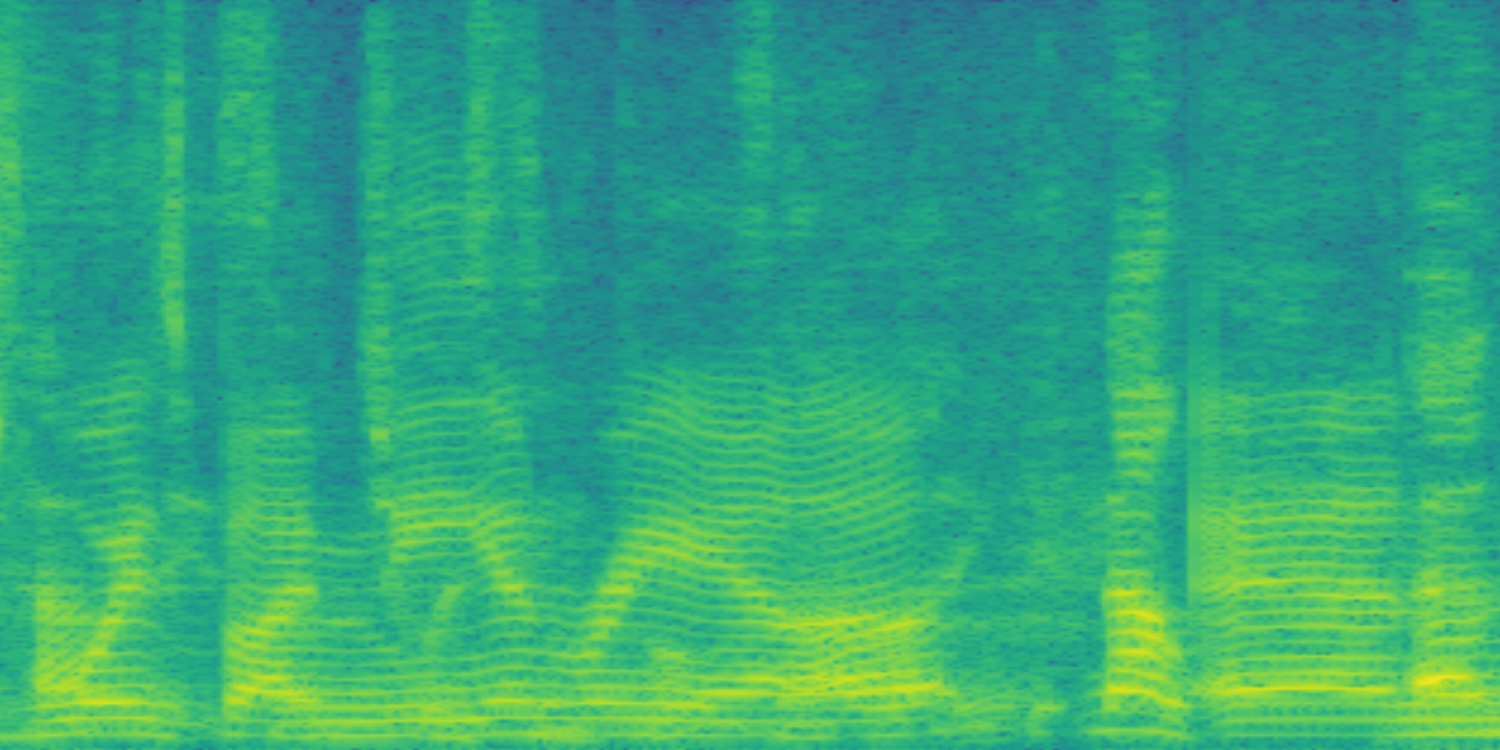
Representative speech separation examples produced by RAV-Net. For each example, the input mixture is shown together with the separation results from Rounds 1–4, and the ground-truth target speech. Corresponding spectrograms are provided to support auditory comparison.

Examples
3 utterances
Format
WAV · mono · 16 kHz
Speakers
2 per mixture
Iterations
R = 4

Listening guide

Compare each stage from left to right

Use the players below to hear how the separated speech evolves over successive rounds. Each example shows both separated speakers. Starting any audio player automatically pauses all other audio players, making direct comparison between stages easier.

Example 1

Speaker 1

Mixture

Mixture spectrogram

Round 1

S1 round 1 spectrogram

Round 2

S1 round 2 spectrogram

Round 3

S1 round 3 spectrogram

Round 4

S1 round 4 spectrogram

Ground Truth

S1 ground truth spectrogram

Speaker 2

Mixture

Mixture spectrogram

Round 1

S2 round 1 spectrogram

Round 2

S2 round 2 spectrogram

Round 3

S2 round 3 spectrogram

Round 4

S2 round 4 spectrogram

Ground Truth

S2 ground truth spectrogram

Example 2

Speaker 1

Mixture

Mixture spectrogram

Round 1

S1 round 1 spectrogram

Round 2

S1 round 2 spectrogram

Round 3

S1 round 3 spectrogram

Round 4

S1 round 4 spectrogram

Ground Truth

S1 ground truth spectrogram

Speaker 2

Mixture

Mixture spectrogram

Round 1

S2 round 1 spectrogram

Round 2

S2 round 2 spectrogram

Round 3

S2 round 3 spectrogram

Round 4

S2 round 4 spectrogram

Ground Truth

S2 ground truth spectrogram

Example 3

Speaker 1

Mixture

Mixture spectrogram

Round 1

S1 round 1 spectrogram

Round 2

S1 round 2 spectrogram

Round 3

S1 round 3 spectrogram

Round 4

S1 round 4 spectrogram

Ground Truth

S1 ground truth spectrogram

Speaker 2

Mixture

Mixture spectrogram

Round 1

S2 round 1 spectrogram

Round 2

S2 round 2 spectrogram

Round 3

S2 round 3 spectrogram

Round 4

S2 round 4 spectrogram

Ground Truth

S2 ground truth spectrogram